Audio frequency generator on a computer. Sound card as a generator
SoundCard Oszilloscope - a program that turns your computer into a two-channel oscilloscope, a two-channel low-frequency generator and a spectrum analyzer
Good afternoon, dear radio amateurs!
Every radio amateur knows that to create more or less complex amateur radio devices, you need to have at your disposal not only a multimeter. Today in our stores you can buy almost any device, but - there is one “but” - the cost of a decent quality device is no less than several tens of thousands of our rubles, and it is no secret that for most Russians this is a significant amount of money, and therefore these devices are not available at all, or a radio amateur buys devices that have been in use for a long time.
Today on the site, we will try to equip a radio amateur's laboratory with free virtual instruments - a digital two-channel oscilloscope, a two-channel audio frequency generator, a spectrum analyzer. The only drawback of these devices is that they all operate only in the frequency band from 1 Hz to 20,000 Hz. The site has already given a description of a similar amateur radio program: “ “ – program that converts home computer into an oscilloscope.
Today I want to bring to your attention another program - “SoundCard Oszilloscope”. I was attracted to this program by its good characteristics, thoughtful design, ease of learning and working in it. This program in English, no Russian translation. But I don't consider this a disadvantage. Firstly, it’s very easy to figure out how to work in the program, you will see it yourself, and secondly, someday you will have good instruments(and they have all the symbols in English, although they themselves are Chinese) and you will immediately and easily get used to them.
The program was developed by C. Zeitnitz and is free, but only for private use. A license for the program costs about 1,500 rubles, and there is also a so-called “private license” - costing about 400 rubles, but this is more of a donation to the author for further improvement of the program. We will naturally use free version a program that differs only in that when you launch it, every time a window appears asking you to buy a license.
Download program ( latest version as of December 2012):
(28.1 MiB, 41,300 hits)
First, let's understand the “concepts”:
An oscilloscope is a device designed for research, observation, and measurement of amplitude and time intervals.
Oscilloscopes are classified:
♦ by purpose and method of displaying information:
– oscilloscopes with periodic sweep for observing signals on the screen (in the West they are called oscilloscop)
– oscilloscopes with continuous sweep for recording the signal curve on photographic tape (called oscillograph in the West)
♦ by processing method input signal:
– analog
– digital
The program runs in an environment no lower than W2000 and includes:
- two-channel oscilloscope with a transmission frequency (depending on the sound card) of at least 20 to 20,000 Hz;
– two-channel signal generator (with a similar generated frequency);
- spectrum analyzer
– and it is also possible to record an audio signal for later study
Each of these programs has additional features, which we will consider as we study them.
We'll start with the signal generator:
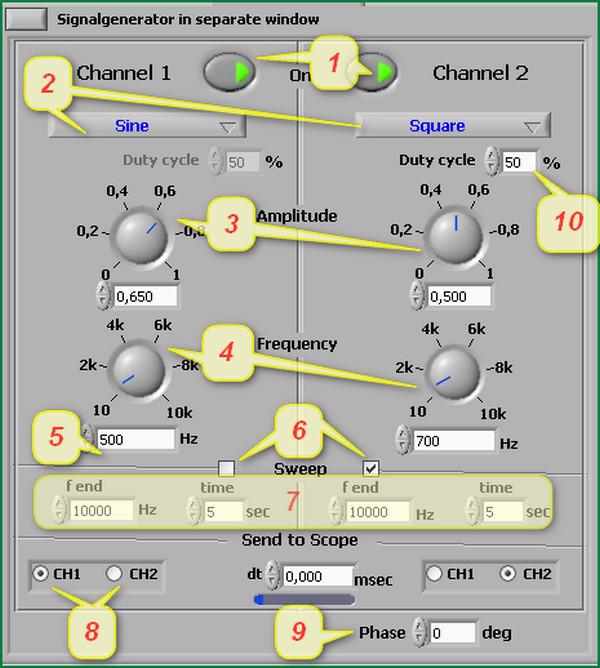
The signal generator, as I already said, is two-channel – Channel 1 and Channel 2.
Let's consider the purpose of its main switches and windows:
1 – buttons for turning on generators;
2 – window for setting the output signal shape:
sine – sinusoidal
triangle - triangular
square - rectangular
sawtooth - sawtooth
white noise White noise
3 – output signal amplitude regulators (maximum – 1 volt);
4 – frequency setting regulators ( the desired frequency can be set manually in the windows under the controls). Although on the regulators maximum frequency– 10 kHz, but in the lower windows you can enter any allowed frequency (depending on the sound card);
5 – windows for setting the frequency manually;
6 – enable the “Sweep – generator” mode. In this mode, the output frequency of the generator periodically varies from minimum value set in the “5” boxes to the maximum value set in the “Fend” boxes for the time set in the “Time” boxes. This mode can be enabled either for any one channel or for two channels at once;
7 – windows for setting the final frequency and time of Sweep mode;
8
– software connection the output of the generator channel to the first or second input channel of the oscilloscope;
9 - setting the phase difference between the signals from the first and second channels of the generator.
10 - setting the signal duty cycle (valid only for a rectangular signal).
Now let's look at the oscilloscope itself:
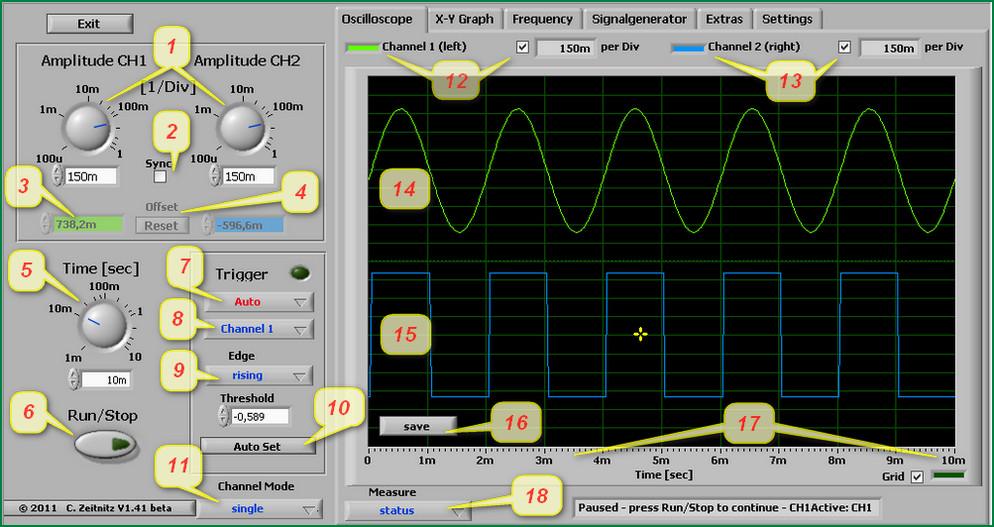
1 – Amplitude - adjusting the sensitivity of the vertical deflection channel
2 – Sync – allows (by checking or unchecking) separate or simultaneous adjustment of two channels according to signal amplitude
3, 4 – allows you to separate signals along the height of the screen for their individual observation
5 – setting the sweep time (from 1 millisecond to 10 seconds, with 1000 milliseconds in 1 second)
6 – start/stop the oscilloscope. When stopped on the screen, the current state of the signals is saved, and the Save button (16) appears, allowing you to save the current state on the computer in the form of 3 files (text data of the signal being studied, black and white image and a color image of the picture from the oscilloscope screen at the moment of stopping)
7 – Trigger – software device, which delays the start of the sweep until certain conditions are met and serves to obtain a stable image on the oscilloscope screen. There are 4 modes:
– on/off. When the trigger is turned off, the image on the screen will look “running” or even “smeared”.
– auto mode. The program itself selects the mode (normal or single).
– normal mode. In this mode, a continuous sweep of the signal under study is carried out.
– single mode. In this mode, a one-time sweep of the signal is carried out (with a time interval installed regulator Time).
8 – active channel selection
9 – Edge – signal trigger type:
- rising – along the front of the signal under study
– falling – according to the decline of the signal under study
10 – Auto Set – automatic installation sweep time, sensitivity of the vertical deflection channel Amplitude, and also the image is driven to the center of the screen.
11 - Channel Mode – determines how signals will be displayed on the oscilloscope screen:
– single – separate output of two signals to the screen
- CH1 + CH2 – output of the sum of two signals
– CH1 – CH2 – output of the difference between two signals
– CH1 * CH2 – output of the product of two signals
12 and 13 – select the display of channels on the screen (or any of the two, or two at once, the Amplitude value is displayed next to it)
14 – output of channel 1 oscillogram
15 – output of channel 2 oscillogram
16 – already passed – recording a signal to a computer in the oscilloscope stop mode
17 – time scale (our Time regulator is set to 10 milliseconds, so the scale is displayed from 0 to 10 milliseconds)
18 – Status – shows the current state of the trigger and also allows you to display the following data:
- HZ and Volts – displays the current voltage frequency of the signal being studied
– cursor – enable vertical and horizontal cursors to measure the parameters of the signal under study
– log to Fille – second-by-second recording of the parameters of the signal under study.
Taking measurements on an oscilloscope
First, let's set up the signal generator:
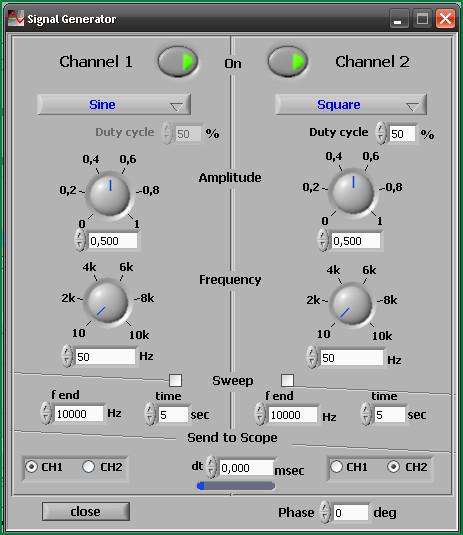
1. Turn on channel 1 and channel 2 (green triangles light up)
2. Set the output signals - sinusoidal and rectangular
3. Set the amplitude of the output signals to 0.5 (the generator generates signals with a maximum amplitude of 1 volt, and 0.5 will mean a signal amplitude equal to 0.5 volts)
4. Set the frequencies to 50 Hertz
5. Switch to oscilloscope mode
Measuring signal amplitude:
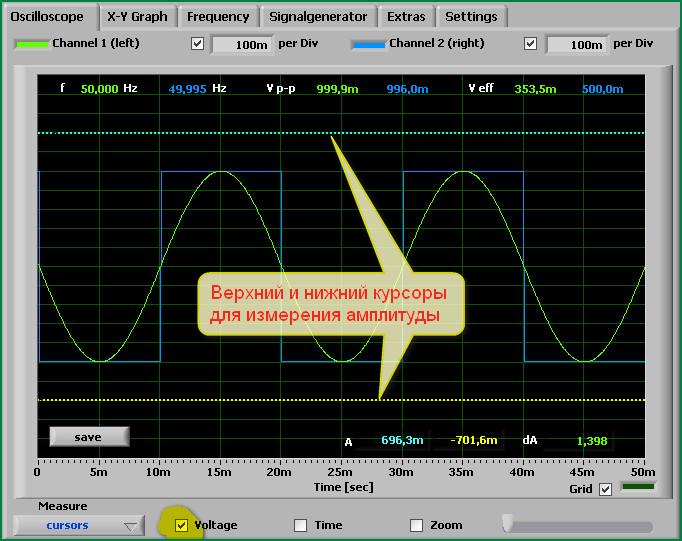
1. Using the button under the inscription Measure, select the mode HZ and Volts, check the boxes next to the inscriptions Frequency and Voltage. At the same time, we have on top the current frequencies for each of the two signals (almost 50 hertz), the amplitude of the total signal Vp-p and the effective voltage of the signals Veff.
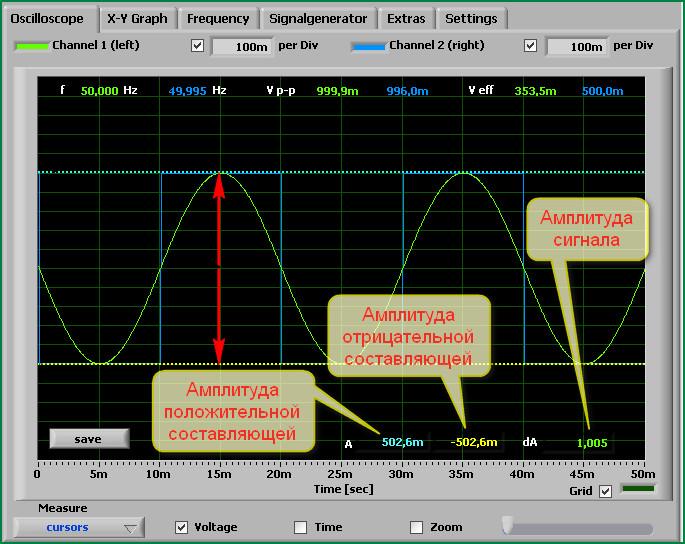
2. Using the button under the Measure inscription, select the Cursors mode and check the Voltage inscription. In this case we have two horizontal lines, and at the bottom are inscriptions showing the amplitude of the positive and negative components of the signal (A), as well as the overall range of the signal amplitude (dA).
3. We set the horizontal lines in the position we need relative to the signal, on the screen we will receive data on their amplitude:
Measuring time intervals:
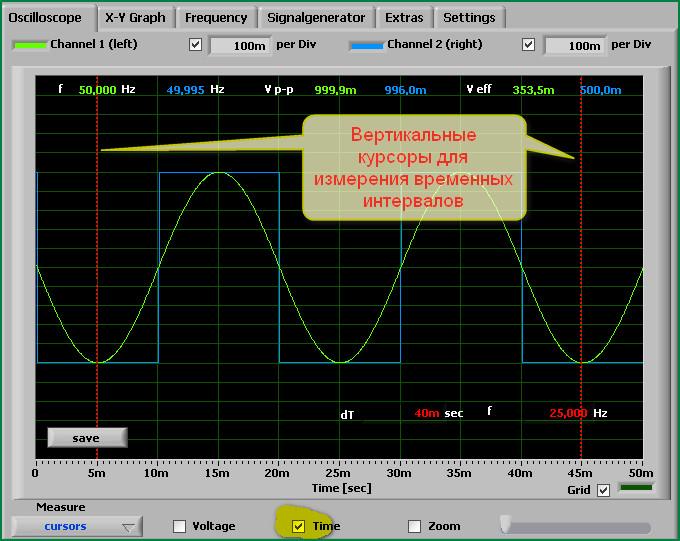
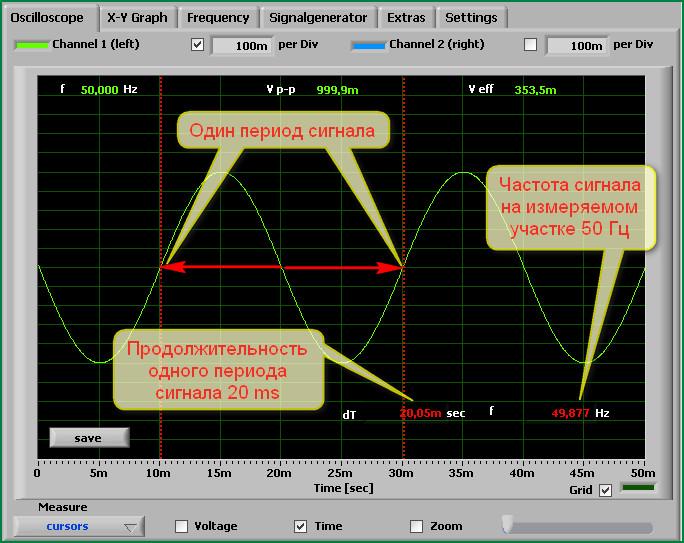
We perform the same operations as for measuring the amplitude of signals, with the exception that in the Cursors mode we put a tick next to the Time inscription. As a result, instead of horizontal ones, we will get two vertical lines, and at the bottom the time interval between the two vertical lines and the current frequency of the signal in this time interval will be displayed:
Determining signal frequency and amplitude
In our case, there is no need to specifically calculate the frequency and amplitude of the signal - everything is displayed on the oscilloscope screen. But if you have to use an analog oscilloscope for the first time in your life and you don’t know how to determine the frequency and amplitude of a signal, we will consider this issue for educational purposes.
We leave the generator settings as they were, with the exception of setting the signal amplitude to 1.0, and setting the oscilloscope settings as in the picture:
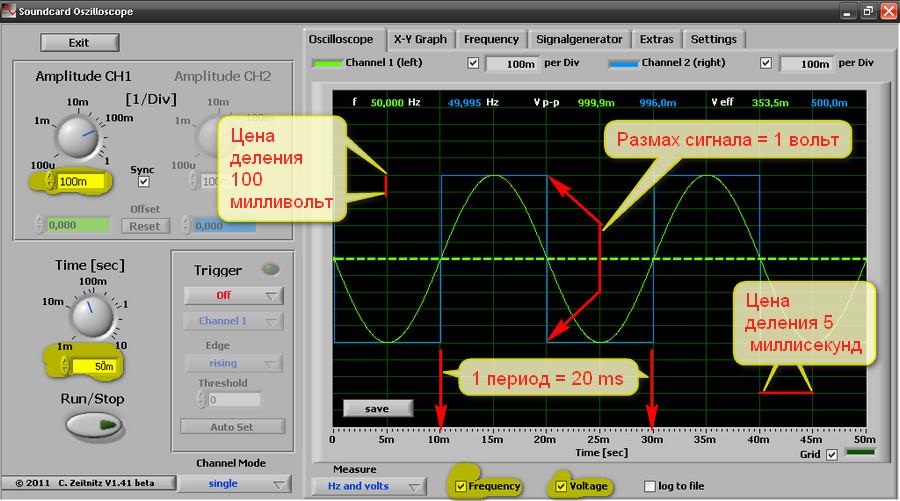
We set the signal amplitude regulator to 100 millivolts, the sweep time regulator to 50 milliseconds, and we get a picture on the screen like above.
The principle of determining the signal amplitude:
Our Amplitude control is set to 100 millivolts, which means that the cost of dividing the grid vertically on the oscilloscope screen is 100 millivolts. We count the number of divisions from the bottom of the signal to the top (we get 10 divisions) and multiply by the price of one division - 10 * 100 = 1000 millivolts = 1 volt, which means that the amplitude of the signal from the top to the bottom is 1 volt. In exactly the same way, you can measure the signal amplitude in any part of the oscillogram.
Determination of signal timing characteristics:
Our Time regulator is set to 50 milliseconds. The number of horizontal divisions of the oscilloscope scale is 10 (in in this case we have 10 divisions on the screen), divide 50 by 10 and get 5, this means that the cost of one division will be equal to 5 milliseconds. We select the section of the signal oscillogram we need and count how many divisions it fits into (in our case, 4 divisions). We multiply the price of 1 division by the number of divisions 5*4=20 and determine that the signal period in the area under study is 20 milliseconds.
Determination of signal frequency.
The frequency of the signal under study is determined by the usual formula. We know that one period of our signal is 20 milliseconds, it remains to find out how many periods there will be in one second - 1 second/20 milliseconds= 1000/20= 50 Hertz.
Spectrum analyzer
A spectrum analyzer is a device for observing and measuring the relative energy distribution of electrical (electromagnetic) oscillations in a frequency band.
A low-frequency spectrum analyzer (as in our case) is designed to operate in the range audio frequencies and is used, for example, to determine the frequency response various devices, when studying noise characteristics, setting up various radio equipment. Specifically, we can determine the amplitude-frequency response of the audio amplifier being assembled, configure various filters, etc.
There is nothing complicated in working with a spectrum analyzer; below I will give the purpose of its main settings, and you yourself, through experience, will easily figure out how to work with it.
This is what the spectrum analyzer looks like in our program:
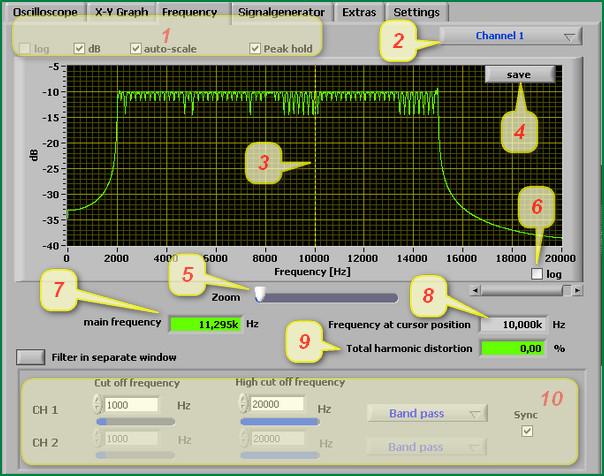
What's here - what:
1. Vertical view of the analyzer scale
2. Selecting the displayed channels from the frequency generator and the type of display
3. Working part of the analyzer
4. Button for recording the current state of the oscillogram when stopped
5. Working field enlargement mode
6. Switching the horizontal scale (frequency scale) from linear to logarithmic view
7. Current frequency signal when the generator is operating in sweep mode
8. Current frequency at cursor position
9. Signal harmonic distortion indicator
10. Setting a filter for signals by frequency
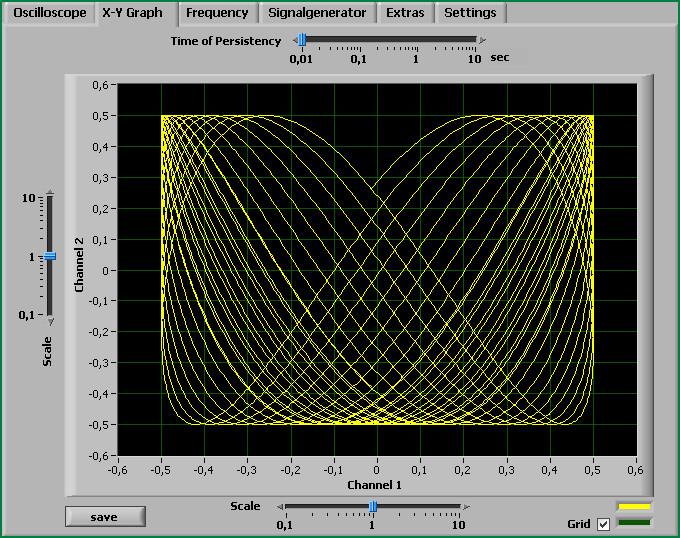
View Lissajous figures
Lissajous figures are closed trajectories drawn by a point that simultaneously performs two harmonic oscillations in two mutually perpendicular directions. The appearance of the figures depends on the relationship between the periods (frequencies), phases and amplitudes of both oscillations.
If you apply signals of close frequencies to the “X” and “Y” inputs of the oscilloscope, you can see Lissajous figures on the screen. This method is widely used to compare the frequencies of two signal sources and to match one source to the frequency of the other. When the frequencies are close, but not equal to each other, the figure on the screen rotates, and the period of the rotation cycle is the reciprocal of the frequency difference, for example, the rotation period is 2 s - the difference in the frequencies of the signals is 0.5 Hz. If the frequencies are equal, the figure freezes motionless, in any phase, but in practice, due to short-term instabilities of the signals, the figure on the oscilloscope screen usually trembles a little. You can use for comparison not only identical frequencies, but also those that are in a multiple ratio, for example, if the reference source can only produce a frequency of 5 MHz, and the tuned source can produce a frequency of 2.5 MHz.
I'm not sure that this function of the program will be useful to you, but if you suddenly need it, then I think that you can easily figure out this function on your own.
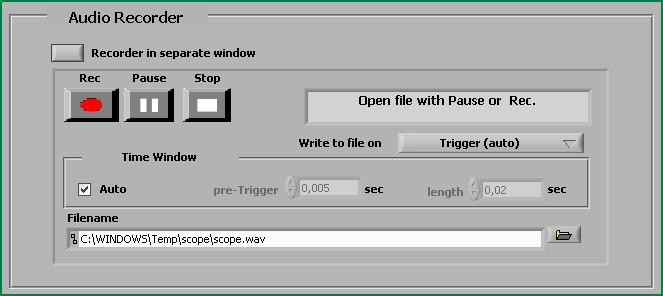
Audio recording function
I have already said that the program allows you to record any sound signal on a computer for further study. The signal recording function is not difficult and you can easily figure out how to do it:
This program implements a low-frequency combined function generator. The generator output signals are fed to two stereo output channels of the computer sound card.
The generator produces signals of the following type:.
- sinusoidal,
- rectangular (meander),
- triangular symmetrical,
- sawtooth growing,
- sawtooth falling.
The device can operate in various modes.
In constant independent mode, the shape, frequency and amplitude of signals on two channels are set separately.
In constant dependent mode, the shape, frequency and amplitude of the signals on both channels are the same, the signal of the second (right) channel can be arbitrarily shifted in phase relative to the signal of the first (left) channel.
In the frequency increasing mode, the signal on the first (left) channel changes in frequency within specified limits with set speed. The second channel signal is turned off.
In the amplitude increasing mode, the signal on the first (left) channel changes in amplitude within specified limits at a set speed. The second channel signal is turned off.
On-screen controls are provided with pop-up comments, and you will easily master the operation of the generator.
The signal frequency can be set in two ways. Installation by direct input is performed in the view window. To edit, click the button to the left of the window, enter a new value, then click Enter key. The second method is a step change in frequency with a given step. For this purpose there are “higher-lower” switches. Two changes the frequency, the third switches the step of this change. The frequency setting resolution is 1 Hz.
The amplitude is set by a stepwise change with a given step. For this purpose there are “higher-lower” switches. Two changes the frequency, the third switches the step of this change. The amplitude setting resolution is 1% of the maximum.
The phase shift between signals in dependent mode is set by directly entering values in degrees. To edit, click the button to the left of the window, enter a new value, then press Enter. The discreteness of the shift setting is 1 degree.
In view of big size sound card clipboards, device control is somewhat slow. The response to switching is approximately 1 second.
When working with the generator, you should not run other programs that create sound effects. You should also not perform prolonged manipulations on the screen with the mouse (move forms, etc.), this may cause a malfunction of the device. If pauses in output signals occur, use screen button restart().
The program remembers settings and settings and restores them the next time you turn it on.
DI HALT:
The method is perverted, to be honest, I would quickly assemble a signal generator of the required shape on R2R. But it happens that sometimes one is missing, sometimes the other, but there is almost always computer junk lying around.
Disclaimer:
I want to warn you right away that barbaric manipulations with the computer immediately cover the warranty on the hardware with a fur organ, and if the radius of curvature of the hands is small, the entire computer or important parts. If you doubt the steadiness of your hand and your capabilities, then it is better to assemble a Frankenstein from trash purely for experiments.
I needed to debug one device on AVR microcontroller. More precisely, receiving data from the ADC. The signal of this data must be of ultra-low frequency, about 1 Hz. Oddly enough, to receive a signal of such a frequency regular means It's hard enough. Sound card The output has filters that do not allow such a low-frequency signal to break through. Therefore, a decision was made to upgrade the sound card.
To play it safe, it was decided to implement this on an external sound card. But this experience is also true for built-in sound cards, but it is worthy of the Jedi.
A Sound Blaster Live sound card was purchased at the hammer. After a quick look, it became clear that it is impossible to understand the circuit design of a 4-layer board without good grass. But it is quite obvious that all weekends and weekends analog signals first they go to the op-amp, and then to the DAC/ADC. Well, OU was quickly googled. Then I paid attention to the microcircuit into which all the signals approximately arrive. She was the second largest. I typed the marking into Google, and lo and behold! Found the datasheet!
Microcircuit pinout.
We are interested in the linear output of the DAC (underlined in red). I selected only the right channel. If someone decides to make an oscilloscope, then they will need to solder to line input(blue rectangle). Of course, through the appropriate decoupling diagram (which can be Googled on the Internet).
In order not to burn the DAC with my hellish experiments, I decided to protect it a little. And I recommend making such a scheme without fail.
Soldered resistor
To output the signal from the computer, I used a VGA connector, which by some miracle was lying in my desk. What's good about this wire: it has 5 separately shielded wires. I just connected a wire to pin 1 (RED signal). Since the screens of all signals are connected to ground anyway, I didn’t bother with the ground connection. Of course, ideally you need to output the analog ground of the sound card (where it is, it looks in the datasheet for the same chip), but I was screwed.
Installed sound system, and the socket of our generator
As a generator I use the primitive program “Tone Generator”, which can be downloaded from here. It allows you to generate sine, saw, square wave, white noise and some strange signal.
Which is quite enough for my purposes.
After it was installed in the computer, I decided to use an oscilloscope to make sure that generation was going on, and I soldered it correctly.
Pure sine of our generator.
Well, the bias without a capacitor in my DAC is about 2 volts. Let's check how the ADC of my microcontroller eats up.
A generator and a program that reads the microcontroller ADC values.
Do not pay attention that the sine measured by the controller is so broken - the sampling frequency is very low.
To shift the zero point, as well as reduce the signal amplitude by half, you need to place one 10 k resistor to ground. Thus, together with the resistor on the sound card, a voltage divider is formed.
I bow out for this, successful experiments.
Post navigation 84 thoughts on “Sound card as a generator”


