How to create a report in 1s 8.3. Setting Dataset Fields
Login to the site as a student
Data composition system 1C 8.3 for beginners: first report on SKD
If you have not read the introduction to this module, please read it: .
To complete the lessons you will need 1C 8.3 (not lower 8.3.13.1644 ) .
If you already have 1C version 8.3 installed, use it. If not, download and install the educational version, which 1C produces specifically for educational purposes: .
The following shortcut should appear on your desktop:
For all the lessons in this series we will use the Gastronom database I prepared. It completely coincides with the base that we used in the school modules when studying queries. Therefore, I expect you to be familiar with its reference books and documents.
If you deleted it, download it again using the following method, unpack it and add it to the list of databases.
Finally, the workbench is set up and now we will create our first report together using the data composition system. It will be very simple to demonstrate the general capabilities of a data composition system (abbreviated SKD).
Setting a goal
Purpose of this lesson- create a report that, in user mode, displays a list of clients with the following fields:
- Name
- Floor
- Client's favorite color.
The report must be external. This means that it will be created and configured in the configurator, and then saved as a separate (external) file on the computer.
To generate such a report in 1C, the user will need to launch the database in user mode, open this file and click the “Generate” button.
Go!
Creating a report
We launch the configurator for the Gastronom database:

From the main menu, select "File" -> "New...":

Select "External report":

Creating a data layout diagram inside the report
The window for creating an external report opens. For the name, enter: " Lesson 1", and then press the button " Open data composition diagram":

The schema creation designer has started. We agree with the default name " MainData Layout Schema" and press the button " Ready":

The main working window has opened, with many tabs and fields, in which we will configure our data layout scheme.
There is no need to be scared - there are really a lot of opportunities here, but we don’t need all of them. Especially in the first lesson.

Now we are on the bookmark " Datasets"We'll stay there."
We write a request through the constructor
The data composition system (abbreviated as DCS) requires us to data, which it will display to the user.
The easiest way - write a request to the base. In school we learned to write and understand requests - so I expect you to have the appropriate skills.
Click on green plus sign and in the drop-down list select the item " Add Dataset - Query":


Our task is to write the request text in this field. Have you forgotten how to do this yet?
I'll give you a hint:
In this query we have selected three fields (" Name", "Floor" And " Favorite color") from table " Directory.Clients".
But don’t rush to write this text in the “Request” field manually.
Now we will create the same request visually, only using the mouse. This method is called " Query constructor".
To call this constructor, click the button " Query constructor..." in the upper right part of the "Request" field:

In the window that opens, drag the table " Clients" from the first column to the second to indicate that it is from this table that we will query the data:

It turned out like this:

Next, let's expand the table " Clients"in the second column by sign" Plus"to see all its fields and drag the field" Name" from the second column to the third to indicate that we need to query the "Name" field from this table:

It turned out like this:

Let's do the same with the fields" Floor" And " Favorite color". The result will be like this:

Click the "OK" button to exit the query builder and see that the query text is automatically added to the "Query" field.
Moreover, based on the text of the request, 1C itself pulled out the names of the fields (the area above the request) that will be used by the data composition scheme:

Now that we have compiled a request, the ACS knows how to obtain data for the report.
Setting up data presentation
It remains somehow visualize this data for the user in the form of a printed form. And this is where ACS can work wonders!
To create such a miracle, let's go to the tab " Settings" and click the settings designer button ( Magic wand):

In the window that opens, specify the report type " List" and press " Further":

In the next window, select (by dragging) the fields that will need to be displayed in the list (drag all of those available to us: " Favorite color", "Name" And " Floor"):

Let's get this result and press the button " OK":

The settings designer closed and the item " Detailed entries":

The report is ready, let's check it. To do this, first save the report as an external file.
Save the report as a file
Open the main menu item " File"->"Save":

I'll save it to my desktop under the name " Lesson 1":

Checking the report in user mode
Finally, let’s close the configurator and go to our database in user mode:

Username "Administrator", no password:

Through the menu, select the item " File"->"Open...":

And specify the report file (I saved it to the desktop under the name “Lesson1.erf”:

The report form has opened, click the button " Form":

Ready! Here is our printable with a list of clients, their favorite color and gender:

The printable form can be easily printed. To do this, just select the item " File"->"Seal...":

So simply, without programming, we managed to create a full-fledged report that users can open in their databases, generate and print.
students - I answer by mail, but first look at.
Login to the site as a student
Log in as a student to access school materials
In our example, the report shows the output of products and services by divisions, product groups and by month.
Here is the main page of the report:
This page is called from the configurator in the menu File – New – External report.
First we add a dataset (DataSet1). In the “Query” window, you can type it yourself, create it using the Query Builder, or load it from a file. The most convenient way is to use the query constructor. Read how the constructor works.
Everything you need is filled in automatically, but some things need to be tweaked.
For example, column headings (the “Quantity” checkbox in the figure above allows you to enter any heading text for this field), you can set the data output format (see Format in the Quantity line). The format can be edited for any type of data – strings, dates, numbers.
On the Resources tab, select the resources themselves and configure the display of results for them:

The Parameters tab contains everything that changes the content of the report (for example, the period for which data will be selected). Filled in automatically based on the request parameters (see first page). Using checkboxes, you can adjust the visibility and availability of these parameters, set the initial value, etc.:
Get 267 video lessons on 1C for free:

And finally, Settings. Here the appearance of the report is drawn - columns, rows, their position relative to each other, groupings, etc. The “Open Settings Designer” button will help you arrange the lines and columns in the desired order. The “Custom Element Settings” button will allow you to display the parameters in the report header:

Pay attention to the column Period.PartsDate.NameMonth. How to display the name of the month in the column header? This is where it comes out.
By the way, it is this setting that allows you to display data for several periods at once in adjacent report columns:

Another important tab is Selected Fields. If it is empty, the report will not be generated. Usually filled in automatically by clicking the “Open Settings Designer” button:

Actually, that’s all you need from the minimum required. As a result, we will have a report that looks like this:
On 1C? how to view employee salaries in 1s?
Often, when working with 1C, an accountant realizes that the functionality built into the standard configuration is not enough. Either it turns out that you don’t know where to look for the necessary data, or you realize that the report does not display all the necessary summary results.
It turns out that many similar problems can simply be solved by creating a custom selection and outputting this data to a report.
You can make such a custom, “your own” selection in several ways. Can
in the configurator, write program code that includes a request that will process the data in the infobase and output the data to the one we created. This is a good method; it allows you to completely manually control the report generation process and make adjustments at any stage of creating the final document. But in order to write the program code for the report and create the final one, you need to have sufficient qualifications, which is often difficult for an accountant or a novice system administrator.
You can also make the necessary report using the so-called ACS. This is an abbreviation. So it is a Data Composition System. Looking ahead, I will say that this method is simpler, because... has a graphical method for displaying the structure of the information base and, in most cases, does not require knowledge of the syntax of the built-in 1C language.
In order not to carry on an unfounded conversation, we will now move from theory to practice. Simply put, we will create a report on the access control system in the 1C program, standard configuration Accounting 8.3. Because Since the configuration is typical and removing it from support is not part of our plans, we will make the report external. Which, however, will not affect the creation process.
So, let's begin
Preparation of a report.
First, let's create and save our external report file to disk.
At this point we need to decide what we will achieve from the 1C database. Those. what data we should display in the generated report. Suppose, for example, that the responsible accounting employee needed to produce a report for a certain period on the salaries received by employees in the context of advances and salaries themselves, indicating positions and decoding documents. It seems that such a report will be of interest not only to accounting employees.
First, go to 1C Configurator and click “File” - “New” in the main menu. In the proposed list, select “External report” and click the “Ok” button to confirm the choice.
Let’s call the newly created report “Employee Salary Report”, for example, and save it to disk.

Creating a report on the access control system.
After saving the external report to disk, click the “Open data composition scheme” button and confirm the creation of a new scheme by clicking on the “Finish” button.


In the data composition diagram form that opens, create a new data set - a request. We will obtain the necessary information using an SQL query.

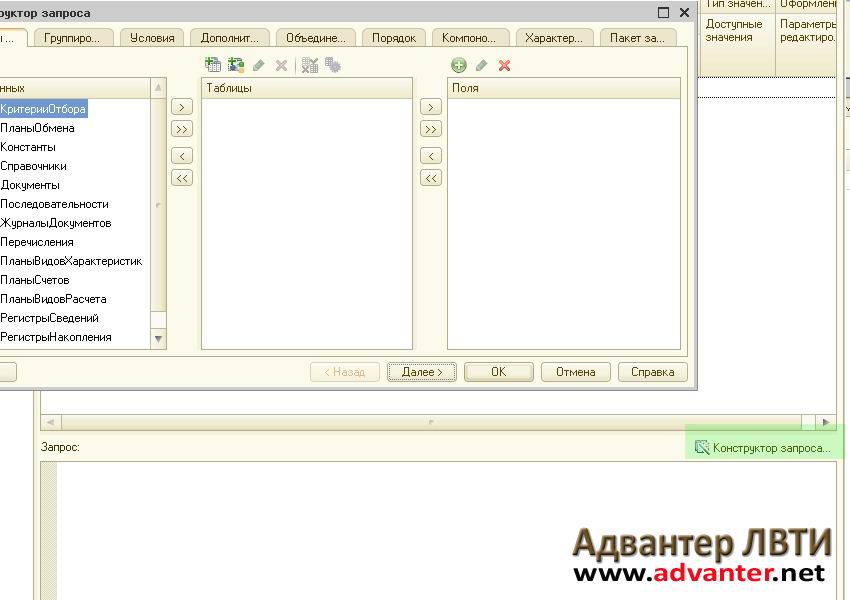
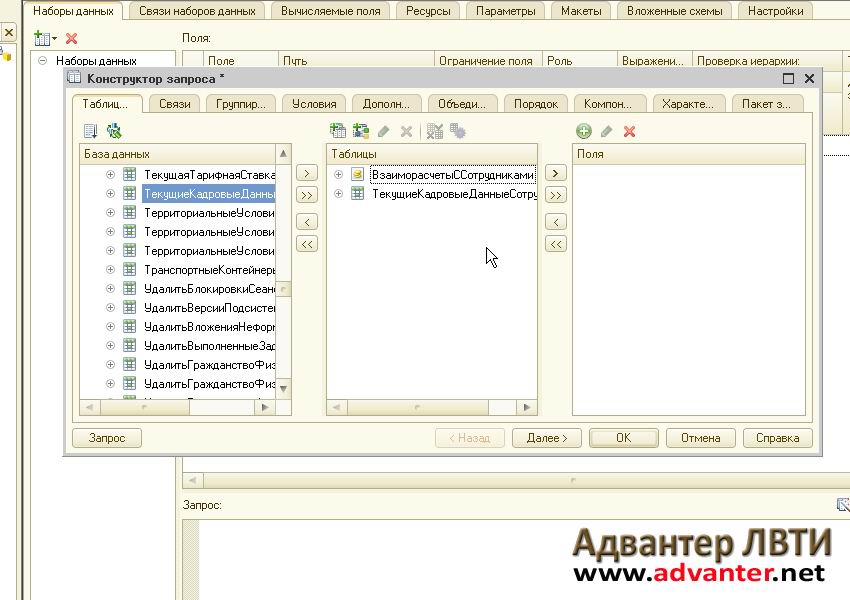
Finally, we have come to the creation of a tool for obtaining the sample data we need. In the query designer, we will select the metadata objects that will participate in the result.
From the column with metadata objects (“Databases”), select tables containing data for our report. We will need: the accumulation register “Mutual settlements with employees” to obtain data on salary movements and the information register “Current Personnel Data of Employees” to obtain information about the position of each specific employee.

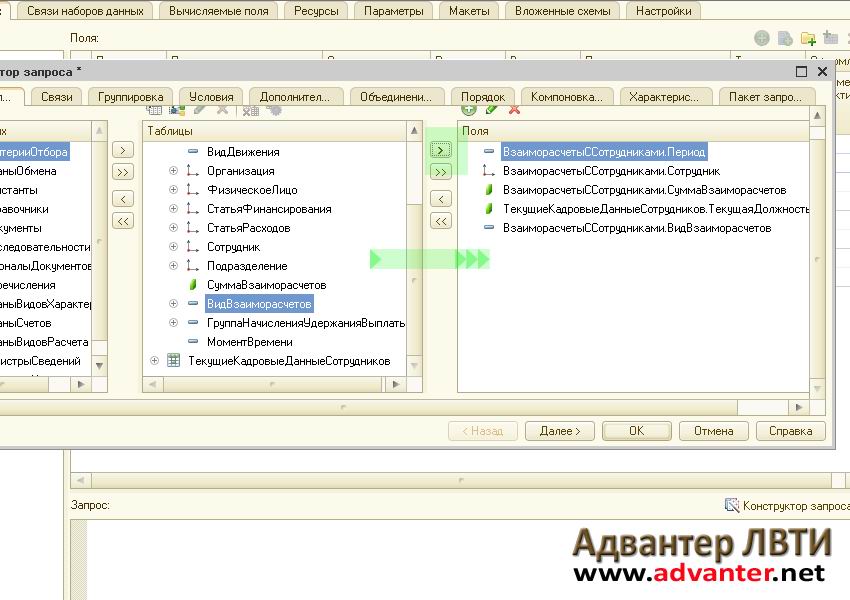
Next, similarly, from the details of these two registers we will select the fields that will form our report. These are Period, Employee, Settlement Type, Settlement Amount, Current Position and Registrar. We will need a registrar for subsequent decryption of financial documents.
On the “Links” tab, we will create a connection of our selected registers using the “Employee” field

On the “Conditions” tab, enter the condition for selecting the type of mutual settlements. Let's add the Settlement Type parameter, which we will set later at one of the following stages.

Also, to determine the period, we will create two conditions that, in fact, will limit the required period. Let these be the parameters DateFrom and DateTo. We will finally describe them at the next stage. Note that to set the period it is convenient to specify the “Between” operand.

We do not need the remaining tabs; at this stage, the completed data will be sufficient to generate the report we need.

Click the “Ok” button
The SQL query we need will be generated in the field.

Generating report parameters
Let’s go to the “Resources” tab and configure the output amount so that this data is calculated based on the employee.

Options.
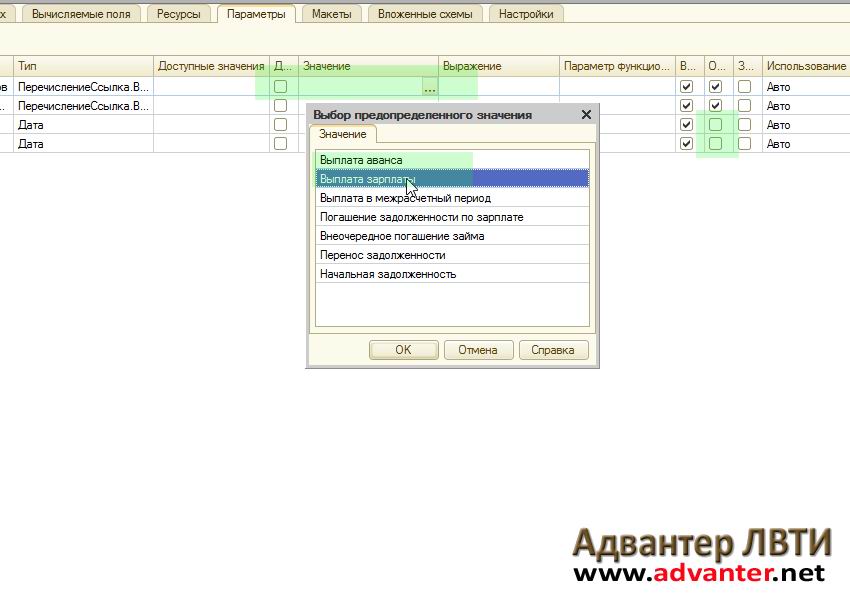
Let's go to the "Parameters" tab. Here we see that the system automatically added the previously entered Settlement Type parameter and two parameters for determining the period. All we have to do is slightly modify the generated Settlement Type line for our report. Because We will need a sample for both salary payments and advance payments, then we will also need the Settlement Type parameter twice.
Copy the line Type of Mutual Settlement by clicking on the first one with the right mouse button.

Next, we indicate that we need data on advances and salaries. For one line of types of mutual settlements, we will select advance payment, for the second - salary. We will also remove the availability restriction for period parameters. This is important because the user will be able to set the period independently.
Formation of the sample type.
For our simple case, we only need to generate a report list without additional settings. Therefore, right-click on the “Report” line and select “Settings Designer”. Let me note for those interested that the access control system, in fact, allows you to work quite widely with sample data to create the appearance of reports. There are other, subtle tools for this. But we are considering the simplest example, so we will limit ourselves to the “Settings Designer”.


In the next window, select the fields that will be displayed in the report. These are Employee, Period, Settlement Type, Current Position, Settlement Amount and Registrar. After editing, click “Next”.

Then, in the next window, we will determine the desired type of grouping. This is for the Employee field. Click “Next”.

And, in the last window we will assign an ordering field. Sort by the Settlement Amount field, in descending order. click “Ok”. 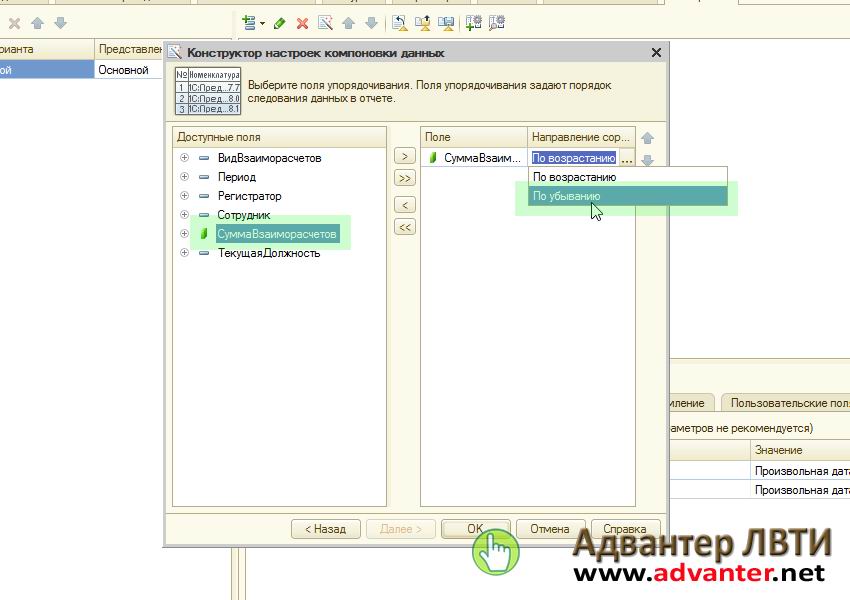
A few finishing touches and our report will be ready. For better visualization, let's add a grouping field Current Position. To do this, double-click the “Employee” line and add the required field. Confirm the selection with the “Ok” button

They say that the name 1C originally meant the phrase “one second”, i.e. programs must produce reports quickly, “in one second.” The speed of the reports is very important, but it is even more important that the reports provide the correct information - we will understand this using the example of creating a simple report in 1C 8.3 based on the Trade Management 10.3 configuration. To create correct reports, it is desirable (even strongly recommended) to be able to configure 1C and to be able to program a little in the internal language and query language of 1C, although, on the other hand, creating reports is an excellent opportunity to start mastering these skills.
This description is educational for understanding the basic principles of creating 1C reports
How to create a report in 1C 8.3
To create a report, you need to open 1C in configurator mode; to do this, in the 1C launch window, select the desired database in the list and click the Configurator button:
In the configurator itself, go to the File menu and select New:

In the menu that appears, select External report and click OK:

After this, a new report window will open. In the Name field, enter the name of the report; it must be without spaces or special characters:

How to make a report using a layout
This method most requires programming skills in 1C, but here we will not analyze the mechanisms for receiving and processing data; we will make a simple report to understand the mechanism for launching the report and displaying the report form on the screen:
In the report window (which opens when creating a report), in the lower list, place the cursor on the Layouts item and, when you right-click, click Add in the menu that appears:

In the layout designer that opens, you can specify the name of the layout, Spreadsheet Document should be selected as the layout type, and then click the Finish button in the designer:

This will open a layout window resembling an Excel sheet:

In this layout, you need to create areas - groups of rows or columns that the program will use as templates, insert data received from the database into them and display these templates on the screen, thereby putting together a report from these parts.
Let's create a report that displays a list of items. To do this, we will create two layout areas: the report header and the item line.
To create a header area, left-click on the line header (where the line number is indicated) to select the line like this (the entire line should be selected with one click on the header):

After that, go to the Table menu of the main menu, go to the Names submenu and click on the Assign name item:

The program will prompt you to specify the Area Name, the name should also not contain spaces or special characters, after that click OK, it should look like this:

Now in the created area you need to enter the text that will be displayed in the report and format it. To do this, enter text in the first cell, for example, “List of items.” Working with cells is similar to Excel.
To format text in a cell, right-click on the cell and click on Properties. The cell properties window will open on the right. Scrolling down the contents of the window, find the Font field and click on the “...” button:

In the window that opens, in the Style section, check the Bold box and click OK:

The layout should look like this:

In the same way, we create the item line area, but do not highlight it in bold:

In the line area you need to indicate that Name is a parameter, i.e. that the real name of the item will be substituted there when outputting the report. To do this, open the properties of the cell with the name and in the properties in the Filling field, select the value Option, this completes the layout setup:

We return to the main report window and in the lower list, right-click on the Forms item and click Add:

In the report form designer that opens, click the Finish button, the report form will open, double-click on the Generate button:

As a result, the button properties window will open on the right side of the screen; in the Action field, click on the magnifying glass:

After this, a form module will open in which you need to program the generation of a report:

First, replace the selected text with the following program code:
//create a spreadsheet document that will be filled with parts of the report and displayed on the screen
TabDocument = New TabularDocument;
//next, we get the layout that was created when creating the report
Layout = GetLayout("Layout");
//now we need to display the report header, for this we get the header area from the layout and display it in a spreadsheet document
AreaHeader = Layout.GetArea("Header");
TabDocument.Output(AreaHead);
//using a query we get a selection of item names that need to be displayed in the report
Request = New Request;
Request.Text = "
|SELECT
| Name
|FROM
| Directory.Nomenclature
|";
//get the item line area from the layout - we will access it in a loop to display each item
AreaString = Layout.GetArea("String");
//process each name from the resulting selection in a loop
Select = Query.Run().Select();
While Select.Next() Loop
//to display the next line, you need to specify the next name in the area parameter (we configured the parameter itself when creating the layout)
AreaString.Parameters.Name = Selection.Name;
//the parameter has been filled in, now you can display the string
TabDocument.Output(AreaString);
EndCycle;
//the spreadsheet document has been generated, now we display it on the screen
TabDocument.Show("List of items");
When the text is copied into the form module, lines starting with a double slash “//” will be highlighted in green - these are comments that describe what each line of code does:

Let's summarize what lines of program code are needed to generate a report:
- It is necessary to create a spreadsheet document that will be filled with parts of the report and displayed on the screen; this is done with the line “TabDocument = New TabularDocument;”
- We need to get the report layout, from it we will get the report structure in parts (areas), this is done with the line “Layout = GetLayout(“Layout”)”
- To display each of the areas, you need to get it from the layout and output it to a spreadsheet document, this is done with the lines "Header Area = Layout.GetArea("Header")" and "TabDocument.Output(HeaderArea)"
- If you need to fill in parameters that become known only when the program is executed, then before displaying the area you need to fill in such parameters, this is done with the line “AreaString.Parameters.Name = Selection.Name”
- And only when the spreadsheet document is filled with all the necessary parts of the report, it is displayed on the screen, this is done with the line “TabDocument.Show(“List of items”)”
And now you can check the operation of the report - open 1C in enterprise mode (button 1C: Enterprise in the 1C launch window). In the main menu, go to the file menu, click Open:

Find and open the saved report file. In the form that opens, click the Generate button:

and we get a list of nomenclature:

This is just one way to create reports in 1C. In the following articles we will look at others.
Reports– these are application configuration objects. They are designed to process accumulated information and obtain summary data in a form convenient for viewing and analysis. The configurator allows you to generate a set of different reports sufficient to satisfy the needs of system users for reliable and detailed output information.
Typically, a report uses a data composition system to generate output. But, generally speaking, a report can contain an arbitrary algorithm for generating a “paper” or “electronic” report in a built-in language.
The report may contain one or more forms, with the help of which, if necessary, you can organize the entry of any parameters that affect the progress of the algorithm.
In this course work, the following reports were created: report on employees, report on customers, report on suppliers.
The employee report contains the personnel's full name, salary and position. The report details are specified when developing the report form in the configurator. The report is generated based on the “personnel” directory (Fig. 19).
Fig. 19. Report on employees in 1C: Enterprise
The buyer report contains the name of the buyer and the price of the product. The report is generated based on the “buyers” directory (Fig. 20).


Fig. 20. Report on customers in 1C: Enterprise
The report on suppliers contains the name of the supplier and registration address. The report is generated on the basis of the “suppliers” directory (Fig. 21).

Fig. 21.Report on suppliers in 1C: Enterprise
Thus, the information reflected in the reports allows us to view information for the entire period of the organization’s operation.
Conclusion
1C:Enterprise is a universal system for automating accounting, accounting for the availability and movement of funds, as well as periodic settlements at the enterprise.
The main feature of the 1C:Enterprise system is its configurability. The 1C:Enterprise system itself is a set of mechanisms designed to manipulate various types of domain objects. A specific set of objects, structures of information arrays, and information processing algorithms are determined by a specific configuration. Together with the configuration, the 1C:Enterprise system acts as a ready-to-use software product, focused on certain types of enterprises and classes of tasks to be solved.
In this course work the following steps were taken:
The theoretical part related to accounting mechanisms 1C: Enterprise;
The practical part is related to the creation of directories (containing information related to the organization’s business processes), documents (reflecting the movement of the organization’s resources), reports (forming summary information on relevant requests).
Ultimately, we can say that the 1C:Enterprise program is effective and economical, and therefore is so in demand in many enterprises.
Bibliography
Baldin K.V., Utkin V.B. – Information systems in economics – M.: Acadenia, 2005.
Baldin K.V., Utkin V.B. – Information systems and technologies in economics – M.: UNITY – DANA, 2003.
Volkova A.K. – information technologies – M.: INFRA, 2001.
Goncharov D.I., Khrustaleva E.Yu. – Solving special applied problems in 1C:Enterprise 8.2. – St. Petersburg: “1C Publishing”
Ilyina O.P. – Information technologies of accounting – St. Petersburg: Peter, 2002.
Radchenko M.G. – 1C:Enterprise 8.2. – St. Petersburg: “1C Publishing”
http://www.1cpoly.ru/buhuchet/
http://v8.1c.ru/overview/Term_000000278.htm
http://v8.1c.ru/overview/AccountingReg.htm
http://ru.wikipedia.org/wiki/1%D0%A1:%D0%9F%D1%80%D0%B5%D0%B4%D0%BF%D1%80%D0%B8%D1%8F %D1%82%D0%B8%D0%B5
http://v8.1c.ru/overview/Term_000000117.htm


