Program for information about the PC system. Which program is better for determining computer hardware?
Introduction Why are all these utilities that display information about the system needed? Every more or less advanced user will tell you in detail about the configuration of their computer. But what about such non-trivial things as the drive mode (is DMA enabled)? Or the system bus frequency (does it make sense to buy additional faster memory - does the processor operate at higher system bus frequencies)? In addition, a very common situation is when you remotely consult with your more knowledgeable friend (for example, about the same upgrade), and he asks you to accurately indicate the chipset and revision of your motherboard.
In all of the above cases, utilities that display detailed information about the system can help significantly. You may ask, what’s so bad about the standard “Device Manager” included in Windows?
Basically, it can answer many questions regarding your system configuration. But the utilities we are considering today appear for a reason - the user needs a convenient interface, a centralized presentation of information (which it is desirable to receive in an accessible form), as well as “tasty” additional plugins (for example, tests for processor and RAM performance). Hand on heart, do you know offhand where all the variety of data about the system is stored (after all, they are scattered in different corners of it)? And in utilities - “everything in one bottle”... In general, in the automotive industry there is such a thing as “tuning” - people turn to a car studio for improved convenience and additional capabilities. In principle, some parallels can be drawn with our case.
The criterion for the subjective assessment of today's test subjects: free delivery (no adware or spyware - this was the main condition for getting on the list), stable operation. Well, if the interface is also convenient, and there are additional modules or plug-ins, then you can’t do without recommending such a program for installation on your computer. And one more important point - we will test under the Windows Vista operating system - we will check the readiness of all applicants for professional suitability in the environment of the new operating system from Microsoft.
Let me make a reservation right away - I will not meticulously describe all the capabilities of the utilities, but will focus on conveying my own impressions from getting to know their functionality (in addition, screenshots will tell you much more). If you are interested, detailed specifications and reference documentation are always available on the project websites, the addresses of which are given at the beginning of each description.
PC Wizard 2007
Program website: http://www.cpuid.com/pcwizard.phpDeveloper: CPUID
The author of the PC Wizard program is familiar to many of us from his famous CPU-Z utility. Both products have been in development for over 10 years, and there is no doubt about the professionalism of the author.
The program distribution takes up about two and a half megabytes in the archive (there is also a version with an installation module). In the case of an archive, after unpacking the program is immediately ready to work (it’s nice that it is localized into Russian), a few seconds after analyzing the system and interrogating the sensors, you can go study the details.

The program interface has five sections: “Hardware”, “Configuration”, “System Files”, “Resources” and “Test”.
"Iron". Information is provided (mostly comprehensive) about all components of the system, be it the motherboard, processor or RAM modules. Take, for example, a processor - you will find out not only its characteristics, but also the current temperature, core voltage, load level, etc. What more could you ask for?

At the bottom of the window there are two tabs "Information" and "Drivers". The first contains a detailed description of specifications, parameters and their values, etc. In the second, information about the drivers is displayed. Not everything is perfect here - for a number of components, PC Wizard could not determine driver data (for example, I did not display information about the drivers of a printer, USB controller, or even an ATI Radeon 2900XT video card). There are minor translation errors - for example, the “Drivers” item in “Hardware” should have been more correctly designated as “Storage Drives”. In addition, a number of section titles are left without translation.
The Voltage, Temperature and Fans section deserves special attention - it summarizes information received from various system sensors.

"Configuration". It contains information about the operating system (version, serial number, user, etc.), web browser, control panel, desktop, processes and threads, dynamic libraries (with decryption), OLE records, Microsoft software products installed TrueType fonts, updates (for some reason this item was empty for me, apparently it only displays information about the Service Pack). There is also a section for installed programs, information about application startup, file type associations with applications, DirectX components, security information, multimedia components, performance statistics, etc.
This section is a little “damp” - in some places there is missing data, in others there are shortcomings (I displayed “winter” time, but in the decoding in the Information panel the correct summer time was indicated). In general, the author still has some polishing to do.
"System files". This section centrally displays information contained in the system files Boot.ini, System.ini, Win.ini, etc.
"Resources". Displays a list of busy interrupts, direct memory access channels, I/O ports, and memory resources. Some points did not work for me - an empty form was given.
"Test". This section contains a number of tests for your system so that you can evaluate its performance. You will be able to evaluate overall performance with the ability to save the results (and compare after an upgrade).

Most of the tests are synthetic, and there are variations in the results. If you wish, you can compare your results with data stored in the PC Wizard database. This can be useful for identifying cases where your system is not optimized properly. I really liked the next point - when comparing your results with standards from the database - you use the slider to adjust the transparency of the window and then overlay it on the results graph to visually compare the chart stripes.

The set includes tests of the speed of reading and writing to the first and second level cache of the processor, the speed of the hard drive and optical drive, and RAM. There is even a video card performance test in 3D, but it is quite primitive. I would also note the MP3 compression test, but for this you will need an audio CD.
Summary: impressions from PC Wizard 2007 are the most positive. It looks like a big beautiful house with many rooms, although several have not yet been finished, but what is there is impressive. Unfortunately, there are some flaws in the Russian localization.
SIW (System Information for Windows)
Program website: http://www.gtopala.com/Developer: Gabriel Topala
Romanian programmer Gabriel Topala presents to us the SIW utility (an abbreviation for System Information for Windows). The utility interface will display the following screenshot:

On the left is a tree structure of the components for which information is provided. The "roots" of the tree are the Software, Hardware and Network sections. In addition, it also includes a Tools menu, which contains useful additions. So, first things first...
Software. Information about the operating system (kernel version, serial number, operating time since last boot, etc.); updates (“patches” from Microsoft); list of programs (names, exact versions, installation date); applications - system and others (name and size of the file to be launched, vendor, directory path, creation date, attributes, etc.); licenses (list of serial numbers of detected licensed programs); regional settings; file associations with applications; list of running applications; list of loaded dynamic libraries; list of file system drivers and kernel level drivers; a list of programs downloaded with Windows; list of installed multimedia codecs; list of ActiveX components; a list of open files (with the names of applications and processes that opened them); list of passwords from autofill, etc.
In addition to standard information components, I will note here such useful things as displayed serial numbers of licensed applications and a list of passwords from autofill forms - for especially forgetful users, of course (and not for malicious purposes).
Hardware. System information (Windows Vista Experience Index, disk space, physical RAM and its load, virtual memory, paging file size, registry size, etc.); motherboard (manufacturer, model, version, serial number, chipset, devices on the board, memory slots, etc.); sensors (information about the temperature of the processor cores and the temperature of the hard drive); BIOS (version, release date, developer, size and characteristics); information about the processor (name, code name, process technology, platform, frequency, multiplier, cache, instructions, etc.); devices (in principle, this section practically provides information from the Windows Device Manager, which is even structured similarly); PCI (information about devices using this bus); system slots; network adapters (name, manufacturer, speed, MAC address, parameters of the established connection); memory (information about installed memory modules - type, frequency, capacity, data transfer rate, error correction, etc.); video (information on video card, monitor, supported resolutions, DirectX version); drives (comprehensive information on hard drives, optical drives, removable USB drives, etc.); logical drives (total space, free space, file system type, device type, bus, etc.); ports (serial and parallel, USB, modem); battery (in the case of a laptop); printers (printers installed in the system, name, attributes, capabilities, port connection, etc.).
In my case, the information from the sensors is not as complete as I would like - for example, the processor temperature was missing (instead, the temperature of each of the two cores was indicated separately, and for some reason it turned out to be five degrees below room temperature), and the cooler rotation speed was also missing processor. I will also note a minus in displaying information on the video card - it is displayed in a raw, unformatted (for greater readability) form. By the way, this is not an isolated case.
Network. Network information (computer name, workgroup name, socket version, IP address, DNS servers, etc. - similar to the information produced by the "ipconfig /all" command); additional information (external IP, country, longitude and latitude of location, Internet provider, running servers, NetBIOS information, etc.); search for network environment; open ports (protocol, application, status, local and remote address, description); shared access (local resources “shared” by you); remote connections, network (search for local network network resources).
I liked this section, especially “Additional Information,” which, by the way, requires you to connect to external network resources.
Useful tools
SIW includes several useful utilities, some of which we will discuss in this section.
Changing the MAC address.

Actually, it allows you to change the MAC address. Use with caution - if your authorization with the Internet provider is also tied to the MAC address, you will encounter problems.
Eureka!

This module allows you to display the password hidden behind the asterisks - for example, in an account field with password auto-fill or in an email client. In my case (Windows Vista), the module could not figure out either the password behind the asterisks in the email client, or the password in the Internet Explorer autofill form - apparently, Eureka! Works maximum under Windows XP.
Password hacking. This module allows you to extract information from .PWL files in the case of operating systems of the Windows 9x line.
Network traffic.

A simple module that displays a graph of network connection activity. It can be useful for determining the real access speed or monitoring suspicious network activity.

Allows you to shut down or restart the computer (with forced closing of applications) after a certain amount of time (in seconds). It can be useful for limiting the time other users (primarily children) can work on the computer - provided, of course, that you have a password set in the BIOS.
Summary: not a bad utility, deserves a solid B, but a number of areas require improvement. It is interesting primarily due to the additional tools included in the package.
System spec
Program website: http://www.alexnolan.net/software/sysspec.htmDeveloper: Alex Nolan
The application is a single executable file, and this immediately wins my sympathy. What will happen next? And then - when we start, an interface of this kind opens in front of us:

This information window is the basic one, and the interface display always returns to it. You get access to components both from a graphical toolbar and from drop-down text menus. In the case of a graphical panel, some buttons have access to additional functions through drop-down icons when you click on the black arrows on the right.
Let's go through the presented "information buttons". Each window displayed by clicking on them, by the way, has options for updating information and printing it, which can be convenient in a number of cases.
Personal. Owner of the computer; operating system build number; system operating time since the last boot; default printer; operating system license serial number; version of .NET Framework libraries; etc.
I must say that some fields were not filled in - for example, the serial number of the hard drive, the original installation path, etc.
Memory. Physical amount of RAM and available (free) space; paging file size and its available capacity; virtual memory sizes; channel width; frequency, etc.
Display. Display information - adapter name, chipset, on-board RAM, graphic resolution, font information.
For some reason the utility did not recognize my ATI Radeon 2900XT video card in this module.
Drive. Drive name; file system type; volume serial number; size and free volume; number of bytes in a sector and number of sectors in a cluster; total number of clusters and number of free clusters; system "flags"; information from the S.M.A.R.T. area.
There is also a menu item CD / DVD Information - displays information about the optical drive (manufacturer; model; firmware version; description; drive letter; status; list of reading and writing capabilities).
CPU. Processor name; family; manufacturer; serial number; frequency; voltage; second level cache size; capabilities and command sets, etc.
I couldn't determine the frequency at which the second level cache operates. When expanded, the CPU button gives another option - displaying a small window with a graph of CPU resource load.
Internet. Internet connection status; start page in Internet Explorer; default directory for saving files; list of recently visited sites; some flags in browser settings.
A little chaotic section, in which I did not detect the installed search bar from Google in the Search Bar item.
Programs. The list of installed programs is displayed, slightly more extensive than the Add or Remove Programs window in Windows XP (or Programs and Features in Windows Vista). Program name, version, manufacturer's website, technical support phone number, installation location on disk, installation source, vendor, path to Readme files, path to uninstaller file, etc. Separately, I would like to note the ability to quickly go to the application manufacturer’s website using the Website button and the colorful Delete Entry button, which allows you to delete an unnecessary entry from the displayed list of installed programs (this can be useful in case of failures that lead to information about the program being left behind after its complete removal).


A simple user will be scared, but seasoned system administrators will feel like a fish out of water. The utility provides information in the following categories: NDIS Info, System Info, System Accounts, User Accounts, Share Info, Network Connections, Network Adapters, Adapters Configuration, System Processes, Computer System, Display Info, System Settings, System Services, System Devices, Logical Disks, Serial Info, Proxy Settings.
In general, despite the information being provided in raw form, you can still find its advantages - the information provided (in particular, useful information about certain operating system settings or device drivers) is very interesting. For me, the utility was unable to provide information about network connections (most likely due to incomplete compatibility with Windows Vista).
Summary: It’s still obvious that FreeSysInfo is a “piece” that is part of complex network audit packages. Here we see a minimum of end-user friendliness and the production of raw information. Previous subjects had the necessary data immediately in sight, but here you have to rummage through the displayed list with technical information and find the necessary information, and “raw” at that (for example, in the “country” field you will see not Russia, but “code 7”, look for it yourself by code, etc.). In general, the project's target audience is advanced users and system administrators.
XP Syspad
Program website: http://www.xtort.net/xtort-software/xpsyspad/Developer: Kenny Heimbuch (xtort.net)
The distribution takes up just under 800 KB and requires installation after downloading. The review included version 7.9 of the XP Syspad utility. After installation, the following window appears in front of us, which actually copies the task manager window with information about running processes:

Next, navigation is carried out by the titles of the lists of menu commands: Admin, Control Panel, Directories, My Menus, Network, Programs, System, Settings, Help.
I will not list all the contents of these categories, I will only say that again we have a situation where the developer did not invent a wheel, but decided to simply place links to many components, information modules and configuration tools for the Windows operating system within the interface of one utility. It is important that XP Syspad “minimizes” into the System Tray and is available from there at any second.
You can launch regional settings, view user accounts, delve into the Control Panel, quickly go to usually difficult-to-reach (read - in a few mouse clicks with a careful look at a large list of folders) directories and menu items, clear the web browser cache, view the address mail client book, find out the IP address, call a calculator, open/close the CD-ROM or DVD-ROM drive tray, copy floppy disks, display a list of installed drivers, etc. This is just the tip of the iceberg - in total, the utility provides centralized access to about two hundred standard functions of the operating system.

There are also some nice little additions - like the ability to display the IP address, Windows and Office serial number, etc.
Unfortunately, the information about the system hardware is not encouraging - here, for example, is what the processor data looks like:

Not very friendly and informative, right? Some menu items do not work (some incompatibility with Windows Vista is obvious, when running under which my XP Syspad noticeably “slowed down”), so if we recommend this product, then first of all - to Windows XP users, which, in fact, is what The very name of the utility warns.
Summary: XP Syspad provides centralized access to components, information modules and settings of the Windows operating system, “sitting” with an icon in the system area. Complete and comprehensive information about hardware components is not provided. XP Syspad is more of a configuration tool with the ability to display a certain amount of information about the system.
Conclusion
I am sure that many readers can add a couple or three more to the list of utilities presented (and some enthusiasts can even add a couple of dozen). There are a whole lot of offers of this kind on the Internet. I chose these five programs simply because they caught my attention at different times and were put aside for further study.Without a doubt, I liked PC Wizard 2007 the most, and the professional level of the creator of this program evokes extremely respectful responses. Yes, some things need to be completed, “combed”, finalized, but all this mainly concerns secondary things.
System Information for Windows is also very good, although it is obvious that PC Wizard 2007 looks more interesting. But SIW contains additional useful components (PC Wizard 2007 is mainly interested in additional tests) such as changing the MAC address, a timer to turn off the computer, etc.
The rest of the participants are either specific, or mediocre, or slightly off-topic applications that I cannot recommend to all users without exception.
ADDITIONAL LIST OF USEFUL UTILITIES
This article, I hope, will have a long lifespan. In this last section, specifically marked in capital letters, I will indicate utilities that are similar in functionality to the current participants in the close examination.Send applicants either to my email address, or talk about them in our conference.
I will also try to supplement this article with fresh samples found. So let's get started...
Lansweeper

Program website: http://www.lansweeper.com/
Developer: Geert Moernaut
Sometimes there is an urgent need to find out the characteristics of your computer. For example, in order to update drivers, upgrade some parts of the system unit, or simply show off to your peers, and in many cases you just need to find out the markings of a particular system component. There are only two ways to do this: and read the markings or check them using software.
The first method, although simple, in most cases may not be available due to a violation of the warranty (if the computer is under warranty). Therefore, let's take a closer look at the second method, how to find out the characteristics of your computer using programs, both built-in operating system tools and additional specialized software.
We look at the characteristics of the computer using the operating system
1. In order to find out the three main system parameters, just go to the “My Computer” tab in the “Start” menu. To do this, you need to hover the cursor over it and right-click on it; in the list that opens, select “Properties”.


This can also be done in one more way: from the “Control Panel” tab, select “System”. In the window that opens below, you can view the same parameters.
2. You can find out what equipment is installed on your computer, but without detailed characteristics, through the “Device Manager”.

To launch it, you can simply type the key combination “Win+Pause”. In Windows 7, in the window that opens, you will need to select the “Device Manager” tab. Now we can see what devices are installed on your computer and their names, for example, processor type and frequency, video card, sound card, network adapters, disks, etc. The Device Manager in XP can be launched using the key combination “Win+Pause” “, then at the top you need to click on the “Equipment” tab, and already launch “Device Manager” in it.
3. This method involves using the integrated “System Information” software. To launch it, you need to click on the “All Programs” drop-down list in the “Start” menu, then “Accessories”, open the “Utilities” tab and launch the “System Information” utility there. You can also do this faster by pressing the Win+R key combination. The program launch window will open. In the “Open” line you need to type “msinfo32.exe”. This is the same utility, only launched through the console.

Using this built-in software, you can obtain basic information about the system and components. But this utility is rather inconvenient due to the complexity of the branches of transitions along the tree. This software can be used in the absence of other software that is easier to understand and read.

4. You can also view system characteristics through the DirectX Diagnostic Tool. This utility is used mainly for testing both video and audio cards. The utility window displays general information about the system and, more specifically, about the video card.

5. You can find out the characteristics of your computer from the BIOS. To do this, when booting the computer, you must press the F1, F2, Del or Esc key. It all depends on the version of the BIOS itself. Further, some knowledge of English is required.
Programs for viewing computer characteristics
For more detailed system performance diagnostics, you can use special programs. For example, AIDA64, ASTRA32, PC-Wizard programs are excellent software both for diagnostics and for testing all components separately.

To begin with, let's say that the AIDA64 (formerly Everest) application belongs to the paid category. However, it is possible to take advantage of the free 30-day period provided by the developers so that the user can familiarize himself with the capabilities of the program. This is quite enough for us. In our case, we will use the AIDA64 Extreme Edition to familiarize ourselves with the basic parameters of the computer. There is, of course, a business version of this application, but for our purposes the Extreme version will suffice. This application must be downloaded from the developer’s website () and installed on your computer.

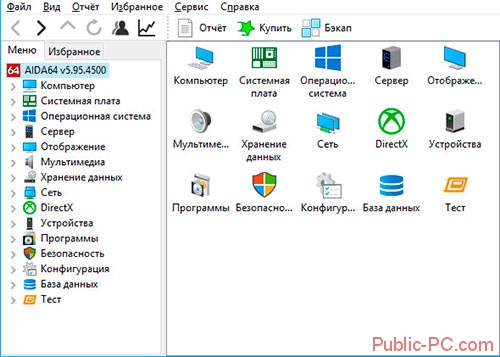
AIDA is very simple and easy to use. The main application window is divided into two parts: the left side displays a tree of the main subsystems of the computer, and the right side displays detailed information about the subsystem selected on the left side. To view summary information on your computer, just expand the “Computer” section, and then select the “Summary Information” subsection.

Selecting this subsection will allow you to find out all the characteristics of your computer: the type of computer, information on the installed operating environment, information about the system board, available partitions, network, peripheral devices, etc.

You can view data on your computer's central processor by selecting the "CPU" subsection in the root "System Board" section. The right side of the application will display the parameters of all processors installed on the PC. This data will tell you about the type of processor installed, its model, clock speed, supported instructions, cache of different levels. You can also find information about the load on the microprocessor cores. If you need more detailed information about the functions supported by the system microprocessor, then feel free to click the “CPUID” subsection.

If you move a little further in your selection and select the “Motherboard” section, then detailed information on the motherboard will be displayed in the main application window. For a desktop PC, AIDA64 will display the properties of the board with its name, the properties of the system bus with its real and effective frequencies. Data on the properties of the memory bus with its width, frequencies, and bandwidth will also be demonstrated. Equally important technical information on the physical parameters of the board: supported CPU socket, installed connectors for expansion cards, the number of slots for RAM sticks, as well as the type of sticks themselves and the type of supported memory. In the same section, the application will show data about the form factor of the motherboard, its physical dimensions and the chipset.

Selecting the “Memory” subsection in the “Motherboard” section will display summary information about the computer’s RAM. Here you can find out information about the RAM and virtual memory available in the system: how much has already been used and how much is currently available for use by the system and applications. Also, this section shows the path to the system swap file.

You can easily find out about the properties of installed RAM modules by clicking the “SPD” subsection. This action will allow the application to show all memory modules installed on the PC, which are displayed at the top of the main window area. Selecting one of the displayed modules will allow you to obtain data that is shown in the lower part of the main area of the program window. By default, when you go to the “SPD” subsection, this part displays the data of the first module displayed in the list. Here you can find the following data about the properties of the module: its type, the amount of memory it provides, the type of this memory, its speed. Also, the width and voltage of the module, timing characteristics and functions supported by it are displayed here.
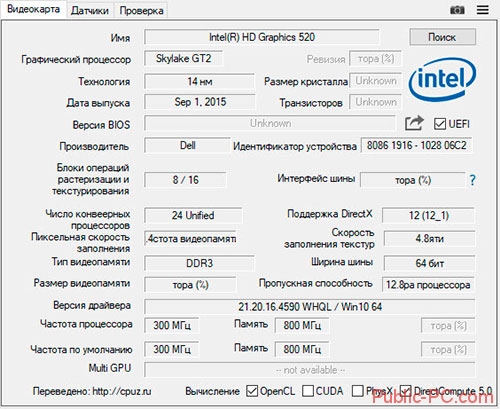
Video card

In order to view data on the characteristics of the video adapter, you need to go to the root section “Display”. Among its subsections you need to find “Graphics Processor”. Selecting this subsection will allow you to display data about the video adapter installed on the PC in the main area of the program. Among them is information about the type of video chip, its BIOS version, the memory of the graphics card (volume, frequency, type), some characteristics of the graphics processor (frequency, technical process).

The “Monitor” subsection of the same root partition will allow the user to become familiar with the main characteristics of the system monitor. These include model, resolution, aspect ratio, vertical and horizontal scan.

AIDA64 allows you to get a wide range of information about your computer's hard drives. To view information about the HDD, click on the “Windows Data Storage” subsection of the “Data Storage” root section. At the top of the main area of the application window, a list of all devices that are associated with data storage will be displayed. The hard drives will be displayed first, and information about the characteristics of the hard drive designated first in the list of devices will be displayed at the bottom of the main area of the window. Among the most useful characteristics: hard drive form factor, spindle rotation speed, read/write speed, etc.
Sensor data
It is necessary not only to be able to view data about the system, but also to analyze the current information provided about the system by its sensors. Data on sensors can be found by going to the “Sensors” subsection of the “Computer” section in the general subsystem tree.

The main sensor information window displays data on the temperature of the microprocessor, as well as its cores. The “CPU” designation shows the temperature of the processor under its cover. Traditionally, this indicator is lower than the temperature indicators of the processor cores, displayed as: “CPU1”, “CPU2”. This is due to the fact that the cover is in direct contact with the heat sink of the heat sink unit. Do not be afraid of the high parameters of the “AUX” indicator, since it means practically nothing. If its values never change, then it is not used by the system. The GPU Diode sensor shows the temperature on the GPU.

Using the ASTRA32 program you can also find out the characteristics of your computer. Like the previous program, ASTRA32 is paid, but the demo version is enough for us. Its interface is similar to AIDA64, also so simple and clear. Download the program from the official website: www.astra32.com and install. By clicking on the link you will see two versions - one for regular installation, and the other is portable, that is, it does not require installation. I will use the second version of the program.

I run the program file astra32.exe as administrator.

In the window that opens, all information about my computer is immediately displayed (the “General Information” tab), namely:
- what processor is installed, its operating frequency, cache levels;
- brief information about the motherboard;
- information about RAM;
- what disks are installed and their capacity;
- information about the video card and sound card;
- information about the operating system, etc.
You can stop there, but for those who want to study the components of their computer in detail, you can select the appropriate section in the left column and study the data that is displayed in the right column.

For example, you need to find out more detailed information about the processor: what Socket it has, how many cores, what power consumption, dimensions, etc. Go to the “Processor” tab and then “CPU”. In the Right window we look at detailed information about the processor.

Finally we come to free programs. PC-Wizard is one of the best utilities for determining the characteristics, configuration and testing of a computer. It can be downloaded by following the link - http://www.cpuid.com.

The program interface is similar to the previously discussed utilities. The only difference is that instead of boring lists, icons are displayed in the right column, and there are also tips for almost every action.
There are development teams that dig a certain topic quite deeply. However, they are not limited to just one platform or operating system. On the contrary, having conquered another height, they strive higher. So the CPU-Z program we are considering today for analyzing the hardware components of the system is authoritative both on the Windows platform, and has recently been doing well on mobile devices running Android.
CPU-Z Features
It would seem that what’s so difficult about writing a program that will show the insides of your computer or tablet? The most difficult thing is to make an application that will process data correctly on all possible combinations of system components. In addition, difficulties arise from the constant emergence of new processors, memory modules and other modules. Therefore, in this class of programs, indicators of quality and authority are the relevance of the database of known devices and components, as well as the ability to work on all computers or tablets.
CPU-Z for Windows
On a computer there is a lot of work for CPU-Z: processor, memory, video card, etc. What useful information can be gained from this highly technical information? Using this program, you can easily determine that the laptop you purchased has an overclocked processor. This means that in six months, when the ventilation holes become clogged with dust, you will have problems with cooling the processor. In addition, when diagnosing faults, you can use data about the system to find out the operating features of a particular component. And when updating hardware, it is important to make sure that the installed hardware is really what is written about on the box.
CPU-Z will also help expose a not-so-honest seller by providing all the information about the processor and memory capacity of the unit you are purchasing. Sometimes this helps a lot to reduce the price or simply avoid buying 100% junk. At auctions for the sale of used laptops or computers, it is the CPU-Z information that is a kind of passport of the unit being sold.

Information about the motherboard will allow you to find the manufacturer's website and check for the latest version of BIOS or drivers, which is very important to ensure stable operation of the computer as a whole.
In general, the CPU-Z program tells the whole truth about the insides of the computer without having to disassemble it.
The Android version does everything the desktop version can do. It also provides the most detailed information about the components of your phone or tablet. From the information about my phone provided by the program, I saw, for example, that one core of my dual-core processor was being cut off to save power. It's nice.

I also saw the actual size of RAM, since the information for my phone model is different on different sites.
Many will find information about the device’s battery useful: its type, temperature and state of charge are indicated. While the last two parameters may not be very necessary, knowing the type of battery is very important if you want to extend its life.
On the “Sensors” tab, I found out that my phone has a proximity sensor (“Proximity sensor”), which is not used by the system. However, you can download a program that allows you to use this sensor.
Publication of results
Both the desktop and mobile versions have the ability to publish your configuration on the Internet. This is necessary, for example, to communicate your configuration to people who want to help you on some forum or in technical support.

When posting, you must provide your username and, optionally, your email. If you provide an address, you will receive a link to the publication by email.
Conclusion
CPU-Z has become a kind of standard that is trusted by both ordinary users and authoritative publications when conducting various reviews and tests of devices. Now it's on Google Play! During testing, not a single inaccuracy was identified in determining the configuration of the phone, tablet and computer. Moreover, it was discovered that there was a sensor on the phone that I didn’t even know about. The only thing missing is a GPS and Wi-Fi test. Many competing test programs already do this.
System information stores information about the computer's hardware components - processor, video card, hard drive, as well as software components. You can view the Windows version, amount of RAM, PC performance index and other data using standard OS programs or third-party software.
When you need data about the characteristics and properties of a computer
For a computer program to work, the system must meet the developer's requirements. Some programs work perfectly with Windows 7 32-bit and 2 GB of RAM, while others require at least 4 GB of RAM and a version of Windows 7 64-bit. Knowledge of system parameters is useful in the following cases:
- when purchasing a new computer to evaluate performance;
- when installing programs and games, updating drivers;
- when selling PCs to inform buyers;
- to correct system failures;
- for PC repair when replacing hardware components.
How to find out system settings and PC information using Windows 7
There are 6 ways to get information about the system using Windows - among them you will find simple methods for beginners and more labor-intensive ones for experienced users.
Via "Control Panel"
The easiest way to get information about Windows properties and performance is through the Control Panel:
- Open "Start" - the button at the bottom left of the screen.
- Find “Computer” and right-click on it.
- Select Properties.
You can open the “System” window by pressing the Win+Pause key combination.
The “System” window will open with information about the version of Windows, the processor and RAM of the PC. You will also see a performance index from 1 to 10 - the higher the value, the better the computer performs. Click on the index button to get detailed information about the performance of your hard drive, processor, RAM and graphics controller.
The performance index is useful when purchasing a PC to compare different models in the store.
Video: how to open system settings
Using the System Information utility
In the Windows "System Information" utility window, you will find information about the processor, BIOS version and Windows build, check the operation of PC hardware resources - CD-ROM, motherboard, video card and others, and also look for errors in the operation of programs and drivers. To open system information:
The System Information menu can be opened using the Run command. To do this, press the Win+R combination on your keyboard, enter “msinfo32” without quotes and press Enter.
Video: How to view system information
Via DirectX Diagnostic Tool
The DirectX Diagnostic Tool is designed to inform users about installed drivers and verify their functionality. To open DirectX diagnostics:
- Click Start and select Run. Or press the Win+R combination on your keyboard.
- In the window that opens, enter “dxdiag” without quotes.
- Click OK.
- Wait while the diagnostic tool updates the information.
- At the top of the window you will see the tabs “System”, “Display”, “Sound”, “Input”. Open each one and find the information you need. Information can be saved as a text file by clicking the corresponding button at the bottom of the window.
Using Device Manager
It will be useful for advanced users to look at the “Device Manager,” which displays information about all PC components and drivers for them. To log into the Manager:

When viewing information about hardware resources, pay attention to the “Device Status” field - there you will see if there are any problems with operation.
Video: How to open Device Manager
Opening parameters via the command line
Test your computer's performance using the Command Prompt. For this:

BIOS
You can view system properties without logging into Windows. Some information is stored in the BIOS and is available for viewing when the computer is turned on.
BIOS is a program built into the motherboard that connects the operating system and PC hardware resources. Ensures the correct operation of the computer.
To get information about the PC in the BIOS, press Pause break during boot and write down the parameters of interest. Then press Esc to continue starting Windows.
Using third party programs
Use third-party applications if standard Windows applications do not allow you to find the information you need about your computer and system.
Piriform Speccy
Speccy is a free Russian-language utility for viewing system parameters. On the official website, manufacturers offer several modifications of the program, including a portable one that works without installation.
The utility allows you to obtain information about the processor model, the amount and frequency of RAM, the operating system build, as well as audio and video devices, the hard drive, and others. By selecting the name of the components in the left menu, you can view detailed characteristics. Information can be saved and printed using the File menu.
Everest
Everest conducts detailed diagnostics of the computer and provides the user with a detailed report in two formats - html and txt. Having opened the program, on the left side of the window you will see a menu with a tree structure, the most interesting item of which is “Test”. You can test memory performance in read, write and copy modes, as well as processor performance. To run tests, use the “Tools” menu at the top of the program window.
SiSoftware Sandra
SiSoftware Sandra analytical utility supports the Russian language and performs full PC diagnostics. Key features:
- viewing the processor temperature;
- editing startup programs when Windows starts;
- informing and searching for drivers for connected devices.
To run diagnostics, in the main program window, open the “Tools” item and click “Analysis and Recommendations”. The program will analyze problems and give a list of recommendations to improve the performance of your PC, some of which can be implemented immediately.
Aida
The Aida program tests computer performance in all aspects:
- CPU;
- network connections;
- disks;
- memory;
- fan temperature and voltage;
- external devices;
- software.
A key feature is PC stress tests to identify reliability problems.
To start testing, select “Tools” in the main window and click “System Stability Test”. Based on the test results, you will see temperature graphs of hardware resources, data on load and processor clock speed.
Have you ever encountered such a situation - the computer starts to malfunction or turns off completely? What is the problem? It turns out that you don’t always need to contact a service center. Try using specialized software. The use of programs is useful not only in cases of malfunctions. Let's look at the best programs for identifying computer hardware and when to use them.
Why do you need such software?
Have you ever encountered situations where you need to know some PC specifications? And this is not the only reason to use such software. Iron detection software is useful if:
- Drivers are updated;
- To find out the temperature of the HDD or CPU;
- When the system slows down and freezes.
Sometimes it is necessary to know the hardware model or version. Users do not remember such parameters. They may not be in the documentation. Let's consider what software is needed in such situations.
Speccy
Official website of the program: filehippo.com/download_speccy. On the main page there will be a link from which we download the “exe” file with the program. Installation is simple and will not cause any difficulties even for beginners. Shows information about RAM, sound devices, CPU and motherboard temperatures. Works on all versions of Windows.

The utility window displays equipment models and small icons indicating the temperature. By double-clicking on them, see the changes that have occurred in five minutes. The utility will not be released by the developers as a professional monitoring tool, but you can find out when it’s time to change the thermal paste on your video card using the program.
Speccy characteristics:
- Shows detailed information about the characteristics of the PC and its devices;
- Uses system tools for diagnostics.
Program for determining computer hardware Aida64
Download the program from the official Internet project: aida64.com/downloads/latesta64xe.
Previously called Everest, but was renamed by the developers to AIDU. Shows detailed information about the system and what is installed. Aida64 is configured for advanced diagnostics of PC operation. Has tests for RAM, CPU, video, HDD.
Important! When checking out your computer, or before purchasing a new one, take a stress test. If the device worked for at least fifteen minutes and no blue screen appeared, everything is fine.
Characteristics of AIDA 64:
- Shows information in real time;
- Generates a detailed report;
- Completely in Russian.
Aida can:
- Edit programs in startup. It is because of them that the PC begins to work slower;
- A section displaying all connected devices. This will help determine its model and find the correct driver. Shows a link from where to download it.
HWInfo
Official website of the utility: www.hwinfo.com. Among the features, we note the ability to download the program installer, and the presence of a portable version. Once launched, HWInfo displays general information about the PC.

Small but powerful program. If you look at the temperature sensors, then in addition to the current indicators, the program will show the maximum permissible parameters for the equipment. If they are close to the maximum, think about it. Works with all versions of Windows.
Important! It is convenient to update drivers, since the utility publishes a link to the manufacturer’s website.
GPU-Z
If your video card is malfunctioning, pay attention to this application. It supports most existing video adapters. Shows information about frequency, RAM resource usage, load. Determines memory timings and BIOS version of the motherboard. Download it from the site cpuz.ru/gpuz_download.htm
Peculiarities:
- Works only with a video card;
- The main feature is monitoring of the main quantities of the device;
- Minimum settings.
CPU Thermometer
Download it from cputhermometer.com

Suitable for those who know what normal CPU temperature is. Performs one function - shows the percentage of processor cores loaded. Minimizes to the system tray and launches along with the OS.
CPU-Z
Official website of the program: cpuid.com/softwares/cpu-z.html

The utility will measure the CPU temperature, evaluate its efficiency and resistance to overloads. The creators have introduced many important features into the application. In addition to testing, the utility receives information about the motherboard, each stick of RAM and GPU. Creates a report exported to txt or html format.
Peculiarities:
- Shows CPU temperature;
- Detailed information about hardware;
- Benchmark (solution to a problem to determine performance) CPU;
- Works on Windows and Android.
Monitor your temperature with Core Temp
Download the program from: alcpu.com/CoreTemp/

Receives information from PC temperature sensors. Checks whether the system is using a lot of CPU. A special feature of the program is the overheat protection function. She will report this and take certain actions. Will put the PC into sleep mode, or turn it on (can be configured as desired).
Shows CPU core values, frequency and voltage on the chip. It differs from similar programs in the ability to display the maximum heating temperature depending on the processor model. Even if you are a novice user, by looking at the minimum and maximum values you will understand whether the temperature readings are normal.
Advantages:
- Consumes few system resources;
- Clear interface;
- Protects the system from overheating;
- Ability to search for new drivers;
- BIOS update;
- Advanced diagnostic settings;
- Free.
Open Hardware Monitor
Located at: openhardwaremonitor.org/downloads/

Dwaremonitor connects to sensors on the motherboard, so it shows accurate and detailed information. The window displays the current and maximum temperature readings. By looking at the values, it will become clear whether the equipment has a tendency to overheat.
Main characteristics:
- Reports an increase in temperature;
- The results are recorded in a log;
- Support for all existing processors, information about which comes from special online databases;
- Compatible with all versions of Windows.
SpeedFan
The utility is located on the website speedfan.ru.softonic.com/

Displays the temperature of the CPU, SMAPT drive and other parts of the PC. A distinctive feature is the regulation of the cooler rotation speed. This is what it will be used for. SpeedFan prevents overheating and helps reduce noise levels.
Important! To get the settings right, try different options. The main thing is to monitor the temperature.
Peculiarities:
- Information about the temperature is shown in the system tray (near the clock);
- The number of fan revolutions is set in the menu.
Conclusion
Of the programs listed above, use Core Temp and Hardware Monitor in combination. The first will protect against overheating. The second will show detailed information about other parameters. To reduce noise or optimize cooling, use SpeedFan. AIDA and CPU-Z are suitable for testing hardware. Compared to their analogues, they show the most truthful results. If you don't like complex software, use the minimalist CPU Thermometer.


