Universal reporting console. Automation of routine tasks using the reporting console Reporting console 1s 8.3
Similar tool for Managed Forms 8.2 ()
Functional features:
1. In the request list, you can create groups and select elements.
2. Output to table, tree, layout, summary report.
3. Calculation of totals by column in the table and tree.
4. Calculation of the amount of allocation in the layout.
5. Execution in the background.
6. Function to show the last result.
7. In the file menu there is a list of recently opened files.
8. Comparison of query texts and query results.
9. Field format
10. Measurement of execution time.
11. Drag & Drop in the tree and in the builder settings.
12. Output a copy in Excel, HTML, CSV.
13. Text generation in the built-in language.
14. More convenient input of list parameters and composite parameters.
15. Grouping the parameters of StartPeriod, EndPeriod and similar ones into a group.
16. An inherited parameter whose value is taken from another request.
17. Filling in parameters from another request.
18. Parameters and their values are remembered and substituted when using the parameter of the same name.
19. Repeated execution of a query for a test.
20. You can open the console in debugging mode and parameters for debugging will be automatically received. You must call the "OpenForDebugging" procedure from the processing module by passing it the "Query" objects or "Report Builder", "Query Builder", "DataComposition Schema" objects for the Report Builder object as a parameter. The builder settings were also obtained. When the console is opened for debugging, the text (debug) is added to the title. Example: Expression = ExternalProcessing.Create("C:d_ReportConsole2.3.epf").OpenForDebug(RequestProducts);
21. Tooltips in the tray when a long query or background execution ends.
22. Group data processing
23. Editable layout
24. A parameter whose value is obtained by executing text in the built-in language
25. Renaming parameters without using a constructor directly from the Parameters table
27. Intuitive filling of parameter values
28. Context clue
29. It is possible to import rcf files from a standard 1C console and dcf files from a standard layout console from 1C and sel IR console format.
30. Converting query text to TSQL
31. Data Analysis
32. Custom mode
33. Export to CSV
34. Functions of the processing manager
35. In the table and result tree, values of type NULL are highlighted with the color and text “Null”
36. Generation of external processing based on SKD ()
There is an excellent template for this mechanism at the link
1. Added plugin mechanism
2. External processing generation template can be selected
3. The period selection form has been improved
4. The data type selection form has also been improved
5. Added options for displaying parameters and selections in the header of a spreadsheet document
6. Launch the console via hotkeys for the active 1C window (+ start debugging)
Good afternoon
The purpose of the article is to show the advantages of using the reporting console for users to solve everyday problems.
For example, such as:
- prompt receipt of data
//those that you cannot “get” with other reports, but you need them; - automation of routine calculations and work with up-to-date data
//especially useful for the work of economists, analysts and specialists with similar functionality; - development of a reporting system to control entered data
//understanding how the data should be reflected in accounting (used or used), you can “sketch” a report that will display all deviations from the norm; this will allow you to identify errors in time and take measures to eliminate them
As a result, you receive the necessary information in the form you require.
There is no need to explain what exactly you want to see. You do everything yourself and do not distract developers.
A mutual compromise arises, which is good news.
And now to the console itself.
The reporting console is a standard processing for 1C configurations (in config version 8.3, those on managed forms, it seems to be missing. However, most likely, it is on the ITS disk. And then it can simply be “put” into external processing. But I don’t dare to say).
There are consoles:
- working only with a request (for example, in);
- allowing the use of a Data Composition System (hereinafter referred to as DCS) (for example, in a BP).
//used in Custom reports.
To work with the console you need to know:
- configuration objects and principles of working with them (directories, documents, accumulations, information, etc.);
- SKD language.
1C has the appropriate books for mastering each stage, so I won’t go deeper into explanations.
In short:
- There are no difficulties in understanding objects (not as a programmer, but as a user).
The purpose of each is clear from the name:
Directories are needed to store reference information that will need to be used more than once and in different places. How can a reference book be useful for reporting purposes? For example, if we need to find out the entire list of entered items, we can unload the reference Nomenclature.Documents serve to record the fact of a transaction.
Similarly with buh. accounting in 1C there are registers. There are registers of accumulation, information, and accounting.
Movement recorders are documents (but there are also independent registers).In accumulation registers, data is accumulated/accumulated. For example, doc. Sales of technical and technical equipment “moves” along the Sales accumulation register with a “+” sign, reflecting an increase in sales. Reg. There are accumulations: circulating and those that, in addition to turnover, provide data on balances (for example, Goods in warehouses). How can we apply this information? You can set the Start and End parameters of the period on the accumulation registers (turnovers, balances and turnovers). Those. select data only for the required period.
Information registers record information in terms of dimensions. Information - resources. To give an example, the document writes movements to the information register Item Prices. Thus, in the context of nomenclature, 1C stores information about prices. Price is a resource. The price is fixed at a certain point in time, because this register is periodic. How is this information useful to us? Knowing that the register is periodic, we can “cut off”, for example, the last price before the date we need or the first after it.
Already at this stage, knowing this, we can create a report that would show us the entire nomenclature that is in the reference book. Nomenclature, putting next to the amount of sales revenue for the required period of time (we would take the information from the Sales registry accumulation). As a result, we would see which products are bought from us and which ones are ignored.
This is the simplest option.
I will refrain from continuing, because there are many objects. Each of them is interesting and we can talk about each for a long time. - To put it very simply, the query language is built on the principle:
* what to choose
* and where.
These are two required parts.
Next, you can impose various conditions, group the data, organize it, etc.
//be careful with requests. It is necessary to build them so that they are optimal - so that their implementation takes little time. - SKD language - an expression language that will allow you to build various calculated fields (useful for economists), can also be used in layout settings. Composing expressions is not difficult. For an ordinary economist who knows Excel, I believe it will not be difficult to master the SKD expression language. Those who work with platform 8.3 have an advantage, because The ACS language for platform 8.3 includes more operators. For example, such necessary ones as rounding and/or exponentiation, as well as a huge number of statistical ones: Standard Deviation of the General Population, Standard Deviation of the Sample, Variance of the Sample, Correlation, etc.
- At the end, you will have to define the standard report settings, so to speak, its main version. The option reflects the final appearance of the report. In it you can group the data as you wish. Set up selections. If desired, you can add other access control systems, resulting in a nested report.
If it doesn’t come to the point of developing a report and using the Console, then still, knowledge about objects and their work, and about working with access control systems will certainly be useful to you in your daily work.
In the previous article, we looked at how to use the “Report Console” to get a report without correcting the algorithms in the configuration. It should be noted that using the “report console” you can both display “corrected” reports and expand the set of reports with new reports. Very often clients ask for some kind of report, and the question always arises of how to include it in the system. If you enable it through the configurator, you must always remember about future system updates and the possibility of “accidentally overwriting” the desired report. Therefore, when ordering a report for programmers, consult with him in advance. It may be better to immediately include it in the query console.
Then the problem of updating the configuration will not be so acute. Of course, if the 1C company changes the structure of storing information in the database, then the report from the reporting console may stop working, but experience shows that the structure of the database does not change often.
Let's say we need a report at hand that would reflect information about employees, their birthdays, dates of hiring and dismissal, tariff salaries, tariff salaries with all allowances, as well as the latest departments and positions of employees.
Let's open our Report Console.

And let's add a new report. Let's call it "Dates of birth/hiring/dismissal". Please note that the program already has reports that can provide such data. We do this to show the IDEA itself, that the system can be expanded with reports without making changes to the configurator.
After adding a report, the report design form will open.

We have already prepared an auxiliary file of report generation algorithms. You can download it from our website "acceptance-dismissal dates.xml". Remember where you saved it and now click the icon for downloading the report algorithms file at the bottom of the designer form.
After downloading the file, just click the "OK" button and our report is ready for use.
Click "Generate" and see what happens

Very good. Now let's experiment with the report

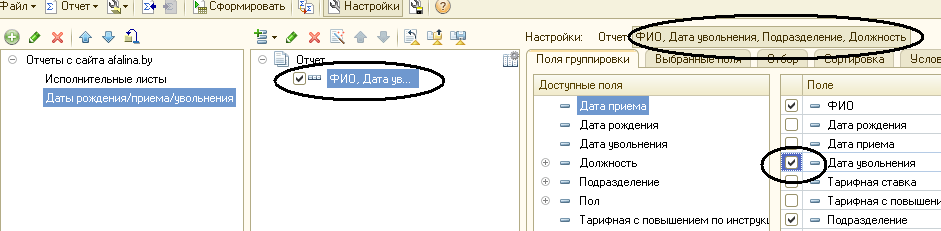
Click on “Full name, date of birth, date of admission..” and on the right click on the “Grouping fields” tab. Or double-click on “Name, Division, Position”. All fields that are displayed in our report are marked here.

Uncheck all fields except “Name, division, position” and click “Create”.
We have received a list of the latest departments and positions of our employees. But all employees, both working and fired, are present here. Let's keep only working employees.

To do this, use the “Selection” tab of the report. Those. First, click on “Report”, and then select the “Selection” tab.

Working employees are employees whose termination date is blank. Let's put a tick in the selection. Let's also select only women. In the line “Gender” - “Equal”, select “female” and click “Generate”.
Everything seems to be correct, but for control, let’s return the “Date of dismissal” column to the report.
Click on “Name, Division, Position” and on the “Grouping Fields” tab. We put a tick on the “Dismissal date”.

Or double-click on “Name, Division, Position”.
And click “Generate”.
And indeed, working women are on our list.
Let's now see which women quit in 2014.

Now in “Date of dismissal” select “Greater than or equal to” and set 01/00/2014

Now let’s click on the “Dismissal Date” in the “Available Fields” table and DRAG it to the selection table.

All that remains is to set the dragged dismissal date to Less than or equal to and the date 01/01/2015. Click "Generate" and enjoy the result.

Thus, by manipulating the output data and selection values, various useful information can be obtained.
Let's consolidate the result. Let's add another report to our console.

Let's add a new report and name it "Personal accounts of employees"

Download the algorithm file for the report "Employees' personal accounts.xml" and load it into the report. Save the report.

Please note that in the selections the “Date of dismissal” is indicated in advance - “Not filled in”, i.e. The report is displayed for currently working employees.
It’s worth noting right away that the selections include the “Bank” field. This means that you can select information for a specific bank. Or, if you specify “Not filled in” as a selection for the Bank, you can display information about employees for whom the bank in their personal accounts is not filled in.

If we remove the checkmarks from the “Date of admission” and “Date of dismissal” fields, we will receive the same report, but in which there will be information only about the individual, bank and personal account.
Try it, experiment. We wish you good work.
Best regards, "Afalina" company
P.s. All reports described in the previous and current article can be downloaded to the reporting console if you download the file from the link from our website and upload it to the reporting console (in the reporting console you must select “File” - “Open” and select the report description file)
You have probably noticed the rapid development of technology in all areas of life. Almost every person has a device such as a computer, tablet, smartphone, we now cannot imagine our life without software products: email, Yandex cards, etc.
Business does not lag behind progress. It is impossible to imagine that a journal-order form of accounting is now used, unless, of course, this is a vegetable stall. And there is a difference between stall and stall. Every company has huge amounts of information and tools that use these amounts. A significant share of these funds is occupied by programs on the 1C platform. In particular, .
All these trends clearly hint to us: in order to become a sought-after and competent specialist, we must understand digital technologies better and better. So, for those who want to increase their efficiency in working with 1C software products, this article will be useful. These could be economists, financial managers, analysts and, to a lesser extent, accountants.
Have you often had to save 1C reports in the format and then process them in a Microsoft software product? I'm sure this is not uncommon. I did it this way myself...
Although this approach has the right to life, it is not at all effective. And that's why:
- Any large data array in Excel takes an unbearably long time to process.
- As a rule, already assembled information is stored in table cells downloaded from 1C, and you want to see it in different cells for filtering.
Of course, one could argue that there are ACS reports that give the user room to maneuver, but setting up an ACS is also not an easy task.
But there is a tool that allows you to avoid all the difficulties, and it is not new at all, every programmer uses it. This is a processing called “1C Query Console”. This wonderful thing is stored on ITS disks. Varies for different platforms.
Get 267 video lessons on 1C for free:
This thing is simply necessary for effective work in UPP. It simply inspires you, you become the ruler of the information base. You do not depend on programmers; you are able to extract almost any information in a matter of seconds.
But, of course, for successful work you need to know something about the 1C configuration. It's not as difficult as it seems at first glance, buy any book that describes the configuration, or take the "Developer's Guide" from the yellow box and look through it. In less than a couple of weeks you will be able to write queries well enough.
How to work with processing
Let's start processing "" in the 1C UPP software product. Open by clicking on the panel: “File – open – path to the processing file.”
You will see a processing window with three windows. In the upper right window, enter the text:
CHOOSE
Organizations.Name,
Organizations.TIN,
Organizations.KPP
FROM
Directory.Organizations AS Organizations
And click the execute button on the control panel. The lower window will display a list of organizations for which records are kept in your UPP database, their Taxpayer Identification Number (TIN) and KPP. Well, you have completed your first request - congratulations.
Now right-click on the upper right window and select the menu item “”. In the left field we see all the configuration elements, in the middle - what we turned to (in this case, the “Organizations” directory), in the right - what will be displayed as a result of the request.
Other tabs allow you to group, set conditions, display results, and many more useful things.
Using the query console, you can access any configuration element, set conditions for displaying information, combine data from different sources, and perform mathematical operations with data. And all this will be done incredibly quickly compared to Excel.
Here is a brief overview of the most useful tool in 1C UPP, without which I cannot imagine working in this program.
Why do I need a query console?
Here you may be indignant: “I’m not a programmer, I’m an economist, an analyst, a manager, why do I need this?!” Wait to be indignant. Let's start with the fact that, having mastered the 1C Query Console and learned how to use it in UPP, you will not become a programmer, and don’t count on it. BUT!!!
- You will save your time, and these are not just words. With this processing you will get the job done perhaps 10 times faster. If you analyze a table from period to period, using various filters and functions for sampling; do not know how to write Excel macros; spend a couple of hours or a couple of days on it... By writing the request once and saving it, you can receive this data in seconds, changing only the date parameters. All that remains is to sit and think about the request code.
- Processing “1C Query Console” is especially useful if the company does not yet have a clear system of key indicators. Every time management asks to add new data to the report or calculate an indicator using a different formula. Here you can show off your knowledge. And who knows what heights this may lead you to.
- Removes your dependence on the programmer. Of course, the result of a query from the console is not a full-fledged report. But it is not the form that is important, but the content. The console will give you any configuration information. And you can start operating with data while the report is at the programming stage.
- Using the console will inevitably force you to deepen your knowledge of SCP. And this will not be the knowledge of a typical user, A knowledge of the configuration architecture of the soft starter. If these are empty words for you, go ahead to the “working” sites and see how much UPP specialists cost.
We live in a digital world in which the ability to work with information increases the chances of becoming more successful and richer!
The query console is very convenient to use when you need to debug some complex data or quickly obtain a sample of certain data.
You can find many different consoles on the Internet. For regular and managed forms, these are usually completely different consoles. Using this you can download the universal query console 1C 8.3 and 8.2, which will work in both cases. Just keep in mind that the console on the managed interface will only open in the thick client.
Working with the Query Console
In the 1C program, the query console opens in the same way as any external processing: menu “File” - “Open”, or using the hotkey combination “Ctrl + O”. If used frequently, it can be added to external processing of the infobase itself.
The left side of the request console displays the list of your requests. This allows you to store not just one request, but several at once. The query tree has a hierarchical structure, which is very convenient for grouping them.
By clicking on the “Add” button, you can add a new request, giving it a name yourself. Also, the built-in functionality allows you to create queries with copying, move up or down the list and much more.
The request text itself is displayed on the right side of the processing form. It can be written manually or using a query builder. The query builder only works in the thick client.
To the right of the designer button is the “Insert Query Statements” button. It will immediately add an empty query structure with condition, grouping, order and totals.

To the right are very useful buttons that will help if you use this request when developing solutions in 1C.

The button allows you to convert your written request into text. In our case it will look like the figure below.

You can save the requests themselves to a file or load them from it. This is very convenient for future use.

Before directly executing the request, you must set its input parameters (if any), then click on the “Run request” button. It is also possible to execute requests not as a whole, but separately as a package.

The viewing mode determines how the query result will be displayed: as a list, hierarchical list, or tree.
The execution result will be displayed at the very bottom of the request console. It also displays the number of rows received and the execution time. You can move query result rows if necessary.

Very often, users ask to select some data and save it in Excel. You may need this too. To complete the task, you just need to select “Display list” in the “More” menu. The program will prompt you to mark the required columns.

In addition to specifying a list of columns for output, you can also specify specific rows here. This is implemented by highlighting the rows in the query itself. Next, in the column selection form, just set the flag in the “Selected Only” setting.
In our example, we displayed all the query result data. You can save them to an external file by copying them from the opened spreadsheet document, or using the hotkey combination “Ctrl+O”. There are many options for saving formats; we chose “*. xlsx".

As you can see, working in the query console is very convenient and useful, so we strongly recommend downloading it and putting it into practice.


