Programs for measuring the temperature of the processor and card. The best programs for determining PC temperature
Several ways to find out the temperature of the processor and video card on a laptop.
Navigation
Most users of desktop computers and laptops are aware of the fact that the overall performance and stability of the device directly depends on the temperature of the processor and video card. The higher the thermal load on the processor and video card becomes, the more clock cycles they begin to skip, thereby preventing the temperature from rising. Naturally, this leads to a significant decrease in the overall performance of the computer.
When a critical temperature level is reached in most processors and video cards, overheating protection is automatically triggered and the computer suddenly turns off. However, such protection does not guarantee 100% that when a critical point is reached, the processor and video card will not fail. Therefore, it is extremely important to be able to determine their temperature and control it online.
The main causes of laptop overheating and methods to combat it
Contamination of internal components
- The most common reason for overheating of the video card and processor is high dust content of the internal components. Despite the fact that the laptop case protects its insides well from dust, the device still needs to be cleaned periodically.
- In order to carry out the cleaning procedure, the laptop will need to be disassembled and carefully cleaned using damp sponges and cotton swabs. If you are an inexperienced user, then doing this yourself is highly not recommended. In the process, you can damage some cable or board and disable the device forever. It is best to take it to a service center or call a specialist to your home.
Thermal paste wear

- Thermal paste is a special substance with a thick consistency that is applied between the processor and the heatsink, preventing overheating. Over time, thermal paste may lose its heat-conducting properties, which will undoubtedly lead to overheating of laptop components.
- As in the case of cleaning dust, you can only replace thermal paste yourself if you have experience. Otherwise, it is highly recommended to take the laptop to a service center. You can buy thermal paste at any electronics store.
Damage to the cooling system (cooler)

- In a laptop, as in the system units of desktop computers, special fans are responsible for cooling. Their failure will undoubtedly lead to overheating of computer components. As a rule, “coolers” break due to dust accumulated inside them, or due to overheating.
- It is very easy to diagnose a cooling system malfunction by sound. If something prevents the cooler from spinning at full power, the laptop will begin to make a crackling or humming sound. In the event that it completely fails, only silence will be heard from the laptop case.
Wrong place to use laptop

- Many people like to use their laptop on their bed. However, most of them do not care about the fact that by placing the device on a soft surface, they block its air blower, as a result of which hot air accumulates inside the case and overheats the laptop components.
- The laptop should only be used on flat, hard surfaces. If you want to use a laptop in bed, then first it is strongly recommended to find a stand for it that will rise 5 to 10 centimeters above the soft surface.
How to measure the temperature of a laptop's processor and video card using AIDA64?
- Since the processor and video card are located inside the laptop case, it is impossible to measure their temperature with any physical devices. The only way is to use special software. There are many specialized programs that can monitor the thermal load on the processor, motherboard, video card and other computer components, but many of them give incorrect indicators and themselves place a very heavy load on the computer.

According to a large number of user opinions, today the best program for this purpose is the program AIDA64 Extreme, which replaced the popular utility on the market Everest. On official website users are offered download a limited version of the program. To use the full range of its capabilities, you will need to pay a certain amount. However, you can easily find hacked full free versions on the Internet. To find out the temperature of the processor and video card using this program, follow these steps:
- Step 1. Download the program AIDA64 Extreme With official website or from any other source, install it on your computer and run it. In the left column, expand the tab " Computer" and go to the section " Sensors».

- Step 2. A window will open in front of you, where the temperature of each processor core will be displayed opposite the lines with the inscription “ CPU", as well as the temperature of each core of the GPU (video card) opposite the lines with the inscription " GMCH».

How to monitor the temperature of the processor and video card online using the Game Assistant program?

In some situations, it may be necessary to constantly display the temperature of the processor and video card on the monitor screen. For example, during games. Of course, you can get by with the program AIDA64, however, constantly minimizing the game window and looking at the indicators in the program is extremely inconvenient. Therefore, to monitor the temperature of computer components during gaming, it is best to use a free utility Game Assistant, the Russian version of which can be download from the official website developer IObit. To check the temperature of the processor and video card using it, follow these steps:
- Step 1. Go to official site Game Assistant program, download, install and run the program on your computer. After launch, you will be taken to the screen with installed games, from where they will be launched. Go to the " Temperature».

- Step 2. The selected tab at the top of the window displays the temperature of the processor, video card, motherboard and cooler rotation speed. Below the indicators are displayed in the form of a graph. In the right column, you can activate the overheating alert function and the temperature display mode during the game, as well as select in which corner the indicators will be displayed.

- Step 3. By default, the temperature in the program is displayed in Fahrenheit ( F). To establish the Celsius scale familiar to many ( C), you need to go to “ Settings", go to the tab " Temperature", tick the line " Celsius" and press the button " Apply».

How to check CPU temperature using BIOS?
- If for some reason you decide not to use third-party software, then you can measure the temperature of computer components via BIOS. This method cannot obtain detailed information about how hot your device is while gaming or running a heavy graphics application, but it is ideal for diagnosing problems with the cooling system.

- To find out the processor temperature in this way, you need to press a special key while the computer is booting to enter BIOS. Typically, the login function BIOS performs one of the keys F1–F12, depending on the motherboard model. Next you need to enter the section “ Hardware Monitor" and in the line " Current CPU Temperature» view the processor temperature.
VIDEO: How to find out the temperature of the processor, hard drive and video card?
Monitoring the CPU and GPU are very important indicators to check the stability of the system as a whole. Overheating of the processor or graphics chip is fraught with consequences both for the stable operation of the system and for the failure of components.
Due to the large number of processors and video cards, developers have released many utilities that can monitor their thermal characteristics. In this material we will describe the most popular processor and video card monitoring utilities used in the Windows operating system.
First we will look at the utility. The utility is very popular among gamers, as it allows you to monitor the temperature of the processor and video card directly in the gaming application. The program was created by IObit, so you can download its installer for Windows on the official website www.iobit.com. Installation is reduced to a couple of clicks, so anyone can handle it. Having opened the program, we will be taken to the first tab “ Games».
We are interested in the second tab “ Temperature».

On the tab that opens, you can see that the temperature indicators and graph are displayed in Fahrenheit. To change the temperature to the familiar Celsius value, you need to go to the program settings and check the appropriate box, as shown in the figure below.

The advantages of the program include a beautiful interface and notification function when the processor overheats. For example, if you play a heavy game that puts a lot of stress on the processor and video card, it will notify you when they overheat.
Many users of personal computers are familiar with the program for testing, diagnosing and determining the characteristics of components EVEREST in Windows OS. Program EVEREST created by the efforts of Lavalys developers. Since 2010, Lavalys has released a successor to the utility EVEREST entitled AIDA64. To the utility AIDA64 all functionality included EVEREST, and new diagnostic and testing functions have been introduced. From us AIDA64 We need functionality that provides data on the thermal characteristics of the processor and video card. Download a free trial of AIDA64 or purchase it. After installation, launch the program.

In the window that opens, we see the rich functionality present in EVEREST, which allows you to check the system. We are interested in temperature, so let’s go to the tabs “ Computer/Sensors».

The tab that opens displays all the information about the sensors, as well as the temperature that these sensors output. In addition to the temperature of the processor and video card, you can also find out in this tab thermal characteristics of HDD and motherboard, and also find out information about the voltage of components.
If you need to identify a problem with a processor or video card, then in this case “ System stability test" You can run the test in the menu " Service».

This test loads the processor and graphics core, as a result of which they warm up to maximum temperatures. If the CPU or GPU is faulty, then this will identify the problematic device.
The example shows that the utility AIDA64 is a worthy successor EVEREST, with the help of which PC users can easily find out the temperature of components, as well as find out all the information about them and check them by performing diagnostics.
Another representative of obtaining computer characteristics and obtaining information from its sensors is the utility. The program is free and you can download it for Windows OS from the official website www.hwinfo.com. After installation, run the utility.

The utility has a simple and beautiful interface, but, unfortunately, does not have Russian language support. To open a window with indicators of all sensors in the system, you must click on the button " Sensors", which is located at the top of the window.

In the window that opens, you can view all data on the temperature of the processor and video card, as well as other components. In addition, this window displays information about the voltage of the components, as well as information about the frequency of the CPU and GPU.
While it's on, it's all maximum and minimum measurements of indicators from sensors are recorded. This is the window's capabilities " Sensors"does not end. The user can customize the display of all information for himself, and also write logs of all readings to a text file.
A program for measuring processor temperature is a fairly popular tool for monitoring the thermal performance of computer components. The program was developed by CPUID, which became famous thanks to the release of the CPU-Z utility. Like CPU-Z, the one in question can be downloaded for Windows OS on the official website www.cpuid.com. By launching the program, the PC user will immediately see all the information taken from the sensors.

Just like in previous utilities, in addition to viewing the temperature and frequency of the CPU and GPU, the user can find out all the information about the voltage of the components.
The example shows that the main purpose is to conveniently view the information provided by computer component sensors. The user can also save all received readings to a text file.
Another program for viewing the characteristics of a computer and obtaining information from its sensors is the utility. The utility was created by the well-known company Piriform Ltd, which became famous for developing the CCleaner utility. Thanks to the company's fame, the new utility has already managed to gain popularity among thousands of PC users. You can download the utility for Windows OS from the official website www.piriform.com. After launching, it will scan the system and display all information about the temperature of the processor and video card in its window.

In addition to thermal indicators, it will show all information about components and operating system. To find out more detailed information, for example, about a video card, you just need to click on the corresponding tab.

From the example it is clear that the utility is very convenient and has a beautiful and understandable interface.
Also note that the utility can save all received readings, both in a text file and in a special snapshot file. This snapshot is for viewing the acquired data on another computer using Speccy.
From the English name of the utility you can understand what its purpose is.

It is distributed free of charge and can be downloaded for Windows OS on the official website www.wisecleaner.com. After launching the utility, it will be built into the notification area and display a pop-up window in which you can see the CPU temperature. Having opened the main program window, we will immediately be taken to the “ Processes " We are interested in the tab " Hardware Hardware Monitor”, which is incorrectly translated into Russian. In the English version, the tab is called “ " We are interested in the tab "", which can be translated as hardware monitoring. By going to the tab " ", we will be taken to a general description of the system. To view information about the processor temperature, you need to click on the left tab “».

CPU By clicking on the tab " Graphics card

", we will find out all the information about the video card, as well as its temperature. The example shows that the utility has a convenient and beautiful interface and provides the PC user with maximum information. In addition, the program has built-in support Center
GPU-Z
Utility GPU-Z created by the Internet portal www.techpowerup.com. You can download the installer for Windows on the same portal. The main purpose of the utility is to display information about the graphics device, as well as display and record data from the video card sensors. After launch GPU-Z we will immediately receive all the information about the characteristics of the video adapter.

On the " Sensors"You can find out the temperature of the video card and find out the frequency of the graphics chip.

Also on this tab you can control changes in the dark characteristics of the video adapter.
Utility GPU-Z is very popular among many PC users and overclockers. The utility gained such popularity due to the provision of accurate information about the video adapter, as well as the ability to save the GPU BIOS.
In this article, we looked at seven popular utilities with which any computer user using the Windows operating system can obtain information about the temperature indicators of both the processor and video card. For continuous monitoring of temperature values, you can also install it on the desktop of your PC.
Controlling and monitoring the thermal performance of computer components will help you prevent their breakdown. Also, the normal temperature of the CPU and GPU contributes to the normal operation of the system and its stability, which cannot be said about overheating components.
By learning about overheating components, the user can prevent their breakdown in advance.
We hope our material will help you take temperature readings from your processor and video card, and will also allow you to prevent them from overheating.
Video on the topic
Checking the temperature of the main PC components is a task that needs to be solved extremely rarely. And not everyone will benefit from such an experience. It’s another matter if the software starts to work unstable, the computer crashes or unexpectedly turns off by itself. Especially when such problems appear only in applications that use the maximum amount of machine resources. A program for the processor and video card is the first thing that will help in diagnosing such problems.
Main signs of overheating
As mentioned above, checking temperature is a fairly rare operation. Usually it is required when testing hardware without overheating. Reasons for such suspicion may be:
If one or more of the above symptoms appear, you must use a program to measure the temperature of the processor and video card. Identifying problems of this kind at the initial stage of their formation can save you from many troubles in the future.
Sometimes, when an alarm signal is received, some users may advise you to remove the computer cover and try to touch each element of the machine to check whether the temperature level is within acceptable limits. Under no circumstances should you act like this!
- Firstly, you can simply get burned. It happens that under load the video card core heats up to 120. Moreover, sometimes the manufacturer indicates that values in this range are normal and will not harm the device.
- Secondly, there is a risk of electric shock. Someone will say: “What’s terrible there - it’s only 12 Volts.” Do not underestimate this voltage, especially since the current can reach so many amperes that you won’t want to look under the cover if it breaks for a long time.
- Third, you can damage expensive equipment. Moving a component or touching a hanging wire to an exposed area of the boards can sometimes cause a short circuit. If the power supply is protected at a high level, the computer will simply turn off. If the power supply is not the most expensive, something will burn out.
And lastly: the program will show the user exact data that can be remembered or recorded. Some applications allow you to keep logs. They will record all readings over time. This makes troubleshooting easier.
Well, now - a mini-review.
HWMonitor
A small application that can do nothing but display indicators of temperature, frequency and voltage of system elements. What is important is that it is absolutely free. There is a professional version, for which you will have to pay a little money, but the functionality of the regular one is quite enough for the average user.

After installation and launch, the program for measuring processor temperature will display a small window with four columns:
- In the first (sensor) you can see the name of the monitoring element.
- The second (value) will indicate the current temperature value.
- In the third (min), the application saves the minimum parameter. That is, if during operation of the software a temperature range from 37 to 70 degrees was recorded, then the number 37 will be recorded in this scale.
- And in the last one (max) the application will show the maximum value observed during its operation.
SpeedFan
Another small measuring program is SpeedFan. Distributed absolutely free. It supports almost all modern devices; this is facilitated by frequent software updates by the developer.

Once SpeedFan is downloaded, installed and launched, its main window will open. It will contain all the main information. First, pay attention to the right side, where the device temperatures are located:
- HD0 (any other index can be used instead of zero) - hard drive.
- CPU - overall temperature of the central processor.
- CORE - CPU core temperature.
- MB - RAM.
- GPU is the core of a video card.
Monitoring the operation of cooling systems in SpeedFan
The left side of the window shows the speed of coolers installed inside the system unit. Information will be displayed only about those devices that have a built-in tachometer. This approach is very convenient. You can compare the number of revolutions per minute when the PC is idle and under load. If the CPU temperature software shows the same number in both cases, it probably needs replacement. Typically, when running resource-intensive programs, the speed of the coolers increases along with the frequency of the central processor.

MSI Afterburner
MSI Afterburner differs from the previous described products in that this program for measuring the temperature of the processor and video card is in Russian. Its main application is overclocking the graphics adapter, however, the monitoring tools in the application are also convenient.
After installation, the main window will open. The interface is made with a twist and will be unusual for the average user. But for us, the program is interesting not because of its design, but because of its information content. The right circle will show the temperature of the graphics adapter. At this time, the lower field displays many graphs that can be scrolled through using the regular scroll bar.

This program for measuring processor temperature for Windows 7 has flexible settings, because not everyone needs the information that is provided by default. To change the number of graphs and their sets, you need to go to the settings by clicking on the gear icon. Then you will need to go to the “Monitoring” tab, where you can check or uncheck the required items.
By clicking the "Minimize" button, you will see that the application will hide in the tray. When running full-screen video games or programs that use a video accelerator, the temperature of the video card will be displayed in the upper left corner on top of all windows. This approach is very convenient for testing the device under load.

AIDA64
Perhaps the most famous program for measuring processor temperature in Russian. I must say that this is not all of its functionality. The application provides the most comprehensive information about the hardware, from that which the driver allows you to obtain, and ending with that provided by the BIOS and sensors installed in the controllers.
However, let's focus on the main thing - temperature monitoring. Pay attention to the character strip that is at the top. There is an icon with a diagram, you need to click on it. After clicking, a window will open with the default settings set by the program manufacturer. It must be said that the initial configuration monitors not all parts of the PC, but the most important ones.
You can change the number of graphs and configure them by clicking on the "Settings" button (or Preferences, if you are using the English version). In the utility that opens, it is possible to enable diagrams for each sensor inside the computer. For example, a program for measuring the temperature of a laptop processor and video card suggests choosing not just the CPU, but also each of its cores separately.

Stress test
It must be said that viewing information about the temperature of the main parts of the PC will not give anything if you perform the check during idle time (that is, with a minimum of programs running). If you run a “heavy” full-screen application, the system will shut down due to overheating, leaving the user wondering: was there really an excess of peak values or should the problem be looked for elsewhere?
This means that monitoring and booting the computer must be performed simultaneously. Not every measurement program provides such functionality. For example, Afterburner only displays information while running full-screen applications. Data in SpeedFan and HWMonitor can only be read when the user switches to their windows. AIDA64, in contrast, simplifies the task and allows you to run a stress test.
This name hides a special tool that will load the system as much as possible, showing the user how this affects the temperature of the devices and their power consumption.
Running the test
To run this check, click on the same charts icon. Pay attention to the upper left corner of the window. There is a list of devices, and there are checkboxes next to them. This identifies the components that will be tested. It is advisable not to apply such measures to the hard drive, although this is possible.
After checking the boxes, click on the "Start" button. At this time, computer testing will begin. It is advisable not to leave the monitor at this time and follow the diagrams. If a bar of any graph sharply creeps up and exceeds a critical value, it is better to immediately disable the test to avoid equipment breakdown, because the problem can be considered identified.
It is precisely because of the implementation of the stress test that many believe that AIDA64 is the best program for measuring processor temperature in Russian.
Then you need to measure their temperature from time to time to make sure that it is within normal limits. If you do not do this, then over time the processor and video card will begin to overheat. Most often this happens due to dust accumulated in the computer, but there may be other reasons, for example, dry thermal paste. Now we will look at a number of free programs for measuring the temperature of the processor and video card that you can use to solve this problem.
is a free program for . With its help, you can change such video card parameters as chip voltage, energy consumption limit, graphics chip clock speed, video memory clock speed and cooler rotation speed. But, in addition, this program allows you to measure the temperature of the processor and video card directly in computer games.
To do this, you need to go to the program settings and enable the display of these parameters on the screen there. After this, you just need to launch any game and watch the temperature, information about which will appear in the upper left corner of the screen.
is one of the best free programs for measuring computer temperature. With it you can measure the temperature of the processor, video card, hard drives and motherboard. This program is developed by CPUID, also known for its CPU-Z program.

In addition to temperature information, the HWMonitor program collects all other data from hardware sensors and displays this information in a user-friendly form. For example, in addition to temperature, this program displays information about voltages, cooler rotation speeds and load levels.
You can download the CPUID HWMonitor program.
is a free measurement program. Core Temp is designed specifically to measure CPU temperature, so it has a number of highly specialized functions. For example, using Core Temp you can display information about the processor temperature on the taskbar. This will allow you to monitor the temperature during operation.
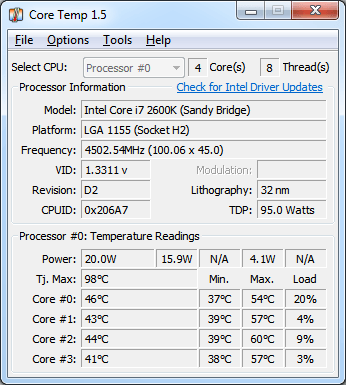
In addition to temperature, using Core Temp you can find out the voltage on the processor, the energy consumption of the processor, as well as all the main characteristics of the processor (processor model, platform, clock speed, number of cores, technical process, etc.).
You can download the Core Temp program.
is a free program for obtaining computer information from Piriform, better known as the developer of CCleaner. The Speccy program collects a lot of various information about your computer and displays it in an easy-to-learn form. Among other things, Speccy can measure the temperature of the processor and video card.

To obtain information about the processor temperature, you need to open the “Central Processor” section of the program. In this section, all technical information about the processor will be available, and at the very bottom there will be a table with temperatures. Information about the video card is available in the “Graphics devices” section.
You can download the Piriform Speccy program.
– a free program for obtaining information about a video card. With its help, you can find out all the main technical characteristics of the video card, as well as measure it, find out the current frequency, load level, cooler rotation speeds, etc.
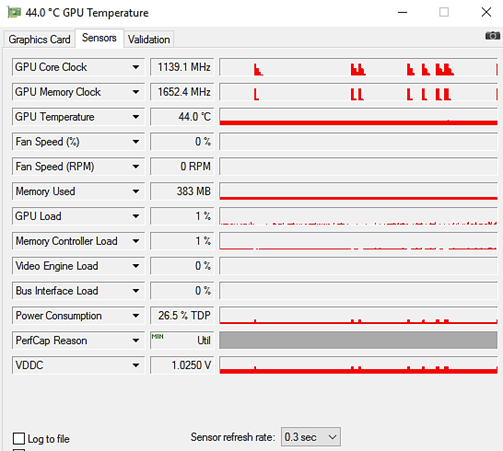
In order to measure the temperature of the video card, after startup you just need to go to the “Sensors” tab and observe the “Temperature” parameter. If necessary, the video card temperature can be displayed in the GPU-Z window title or in a LOG file.
You can download the TechPowerUp GPU-Z program.
is another free program from CPUID. Perfmonitor 2 is designed to measure processor temperature, as well as collect other data about its operation. For example, using this program you can find out the load on the processor, as well as the number of instructions executed for each watt of energy spent.

At the same time, Perfmonitor 2, like the Core Temp program, can display information about the processor temperature on the taskbar.
Computer components tend to heat up. Most often, overheating of the processor and video card not only causes the computer to malfunction, but also leads to serious damage, which can only be solved by replacing the component. Therefore, it is important to choose the right cooling and sometimes monitor the temperature of the GPU and CPU. This can be done using special programs, which will be discussed in our article.
Everest is a full-fledged program that allows you to monitor the state of your computer. Its functionality includes many useful tools, including those that show the temperature of the processor and video card in real time.

In addition, this software contains several stress tests that allow you to determine critical temperatures and load on the CPU and GPU. They are carried out in a fairly short period of time and a separate window is allocated for them in the program. The results are displayed in the form of graphics of digital indicators. Unfortunately, Everest is distributed for a fee, but a trial version of the program can be downloaded absolutely free from the official website of the developer.
AIDA64
One of the most popular programs for testing components and monitoring them is AIDA64. It allows you not only to determine the temperature of the video card and processor, but also provides detailed information on each computer device.

In AIDA64, just like in the previous representative, there are several useful tests for monitoring components, allowing you to determine not only the performance of some components, but also check the maximum temperature before the thermal protection is activated.
Speccy
Speccy allows you to control all your computer hardware using built-in tools and functions. Here the sections provide detailed information about all components. Unfortunately, no additional performance and load tests can be performed in this program, but the temperature of the video card and processor is displayed in real time.

The processor viewing function deserves special attention, because here, in addition to basic information, the temperature of each core is displayed separately, which will be useful for owners of modern CPUs. Speccy is distributed free of charge and is available for download on the developer's official website.
HWMonitor
In terms of functionality, HWMonitor is practically no different from its previous representatives. It also displays basic information about each connected device, displaying temperature and load in real time, updating every few seconds.

In addition, there are many other indicators that allow you to monitor the condition of the equipment. The interface will be completely understandable even to an inexperienced user, but the lack of Russian language can sometimes cause difficulties in working.
GPU-Z
If the previous programs on our list were focused on working with all computer hardware, then GPU-Z provides information exclusively about the connected video card. This software has a compact interface that contains a wide variety of indicators that allow you to monitor the state of the graphics chip.

Please note that in GPU-Z the temperature and some other information is determined by the built-in sensors and drivers. If they do not work correctly or have been broken, the readings will most likely be incorrect.
SpeedFan
The main function of the SpeedFan program is to adjust the rotation speed of coolers, which allows you to make them quieter by reducing the speed, or, conversely, increase the power, but this will add a little noise. In addition, this software provides users with a large number of different tools that allow them to monitor system resources and keep track of each component.

SpeedFan provides information about the heating of the processor and video card in the form of a small graph. All the parameters in it are easy to customize so that only the necessary data is displayed on the screen. The program is free and can be downloaded from the developer’s official website.
Core Temp
Sometimes it is necessary to constantly monitor the state of the processor. It is best to use for this some simple, compact and lightweight program that practically does not load the system. Core Temp meets all of the above characteristics.

This software is able to work from the system tray, where it monitors the temperature and load on the CPU in real time. In addition, Core Temp also has a built-in overheat protection function. When the temperature reaches the maximum value, you will receive a notification or the PC will be automatically turned off.
RealTemp
RealTemp is not much different from the previous representative, but it has its own characteristics. For example, it contains two simple tests to check the component, allowing you to determine the condition of the processor, identify its maximum heating and performance.

This program has a large number of different settings, which will allow you to optimize it as much as possible for yourself. Among the shortcomings, I would like to note the rather limited functionality and the absence of the Russian language.
Above, we examined in detail a small number of programs for measuring the temperature of the processor and video card. They are all somewhat similar to each other, but have unique tools and functions. Select the representative that is most suitable for you and begin monitoring the heating of components.


