Basics of the idef0 methodology. Methodology for describing processes based on the IDEF0 methodology. Functional method IDEF0
A picture is worth a thousand wordsFolk wisdom
Often in my work there is a need not only to study and solve a certain problem, but to identify its location in the overall operating model of the company. It is not enough to understand that a certain unit is not working correctly, it is important to understand how it interacts with others. Otherwise, it is impossible to identify all existing problems and choose the optimal method for solving the problem. And for this you need to study the work of the company and draw up its functional model.
Of course, in theory, the manager should have a functional model of the company’s work, and it doesn’t matter whether we are talking about organizing the work of a warehouse or an IT system from lead to application. But in reality it almost never turns out to be, and therefore, in the process of studying and searching for a solution to the client’s problem, I also create a functional model of the company’s work or a certain process (function) on my own.
A few words about the advantages of graphics
As you know, IDEF0 functional models are always graphical diagrams. They have their own characteristics and composition rules. We'll talk about this a little later. Now I would like to give a couple of examples of the effectiveness of graphics. Why am I focusing on this? Most likely, after my statement about the need for a functional model of the company’s work, many people thought that all this was not necessary, they could explain in words how this or that function works in the company. This is what I want to talk about.Let's start with a short excursion into history. Let's go back to the distant year 1877, during the Russian-Turkish War. It was then that the printer Sytin first used graphics to describe military operations. Now all this is familiar to us; when describing any battle, cards with arrows appear before our eyes, which clearly show the course of the battle. And in those days, military actions were described in words. For each battle there are many, many words. And in the end it was very difficult to understand what was happening.
Therefore, Sytin’s idea was truly revolutionary - he began printing lithographic copies of maps indicating fortifications and locations of military units. These cards were called “For Newspaper Readers. Allowance.” The idea turned out to be so relevant that the first edition of the “Benefits” sold out instantly. And then such applications were in great demand. The reason is obvious. Graphics helped to understand what was almost impossible to understand with words alone.
I can also give a similar example of the helplessness of verbal descriptions from my own practice. One of my customers really asked me to take on the implementation of an ERP system for his company. When I asked if they had any technical specifications, I received the answer: “Yes, they do. But it’s 400 pages.” At the same time, the client complained greatly that my colleagues, whom he had contacted earlier, either refused the project altogether or quoted clearly inflated prices. After I saw that the technical specification actually had 400 pages, and it consisted solely of a text description, I understood the reasons for the developers’ behavior. Reading such a volume of text, delving into it, understanding all the nuances just to understand the task and name the price is really very difficult.
I offered this client an alternative option - to describe everything that was possible graphically in the form of notations. Showed him examples of modeling. As a result, they are now rethinking their wishes and the design of the technical specifications.
I also know many other examples where graphical modeling of business processes helped both my colleagues, business consultants and developers, and businessmen themselves.
Why is this important to my work?
My work always involves making changes to the existing system. And in order to make changes and get the desired result, you need to study what already exists. And it doesn’t matter what exactly we are doing - setting up or installing a CRM system from scratch, creating an effective ERP system, integrating various systems to increase automation of work in general. In any case, first, you need to get an idea of the existing work scheme, and only after that you can propose some changes and think through options for solving the problem.After studying the current state of affairs, I, like any other third-party specialist, create a commercial proposal in which I reveal in as much detail as possible my vision of the current situation, as well as the actions that need to be performed to solve the problem, and, of course, the expected result.
Such work survey reports are voluminous and take up more than one page, which, on the one hand, is necessary, but on the other, complicates perception. At first, like many others, I thought that voluminous reports were good, because a person pays for the work and you need to provide him with as much detailed information as possible.
Common mistakes
Functional modeling is performed using a variety of tools, including those not intended for modeling. In the latter case, there is no error checking and no standard restrictions. The desire to increase visibility and lack of experience often result in mistakes.Using different colors
All elements in the diagram are equally important. In functional modeling, there are no more or less important elements. The disappearance of any will lead to disruption of the process and manufacturing defects.Often when modeling on paper or in various programs, users try to increase visibility by using different colors. This is one of the most common mistakes. In fact, the use of multi-colored arrows and blocks only introduces additional confusion and also distorts the perception of the diagram.
Your model should be readable in black and white, without any additional color schemes. This approach simultaneously helps to avoid misunderstandings and disciplines the model creator, resulting in increased readability and literacy of the model.
Too many blocks
When drawing up a model, they often try to display on one sheet all the nuances of the company’s work with all the details. The result is a very large number of blocks with a large number of control arrows. In this case, readability is lost.The best option is enough detail to understand the issue, and nothing more. Detailed details of the work of each department or even employee can be revealed when choosing a detailed view of a particular process. And such a structure is created only if it is really necessary for work or decision-making.
Violation of the structure when making adjustments
Be careful to ensure that there is no confusion or processes without inbound, outbound, or other important elements. For example, if in the example above, I find it necessary to shift the point of view to the copywriter, I will remove the author from the diagram. And then the control elements “author’s experience and third-party sources”, as well as the publication plan, become unnecessary. After all, the author uses them. A copywriter works with an audio file. And if they remain in the general scheme, then when detailed, they will lead in an unclear direction and cause confusion.Likewise, if I decide to add a block, it's important to make sure it also has all the required attributes. Care is very important here, since when modeling complex business processes, changes in one part of the model may lead to changes in another. They definitely need to be included.
Rules for naming control elements and blocks
It is important to remember a simple rule: control arrows are called nouns, blocks are called verbs. This is accepted in the IDEF0 standard, and this approach helps to avoid confusion and errors.Most often, mistakes are made when naming blocks. For example, instead of “Create an article,” they write “Creating an article.” Blocks in this approach are actions, and therefore they should always be verbs.
Benefits of using IDEF0
- The very first benefit is obvious – visibility. You yourself begin to understand how this or that system works, and you can also clearly explain where the “thin spots” are in this system and how your solutions will help get rid of them.
- Mutual understanding and absence of discrepancies. When discussing the work of a company using a functional model, you have visual and intuitive blocks of tasks with control elements. In addition, functional modeling involves creating, if necessary, a glossary in which symbols and terms are revealed. As a result, you and the client, manager, and other employees speak the same language when discussing a problem.
- Simplicity and high speed of model creation. Of course, learning to model is not as easy as it seems. After all, a diagram is, in essence, a super-dense presentation of information, which is very good for understanding, but implementing such a presentation requires a special approach. The analyst’s brain acts in this case as a very powerful press on the one hand, and a filter on the other. But with experience this process becomes very fast. As a result, you get a tool that will help you figure out what is happening in a particular system yourself, and with the help of a visual aid created in a short time, illustrate important points to colleagues or customers.
- Discipline and no mistakes. The IDEF0 standard provides strict frameworks and rules. This approach creates discipline, and the habit of acting within the standard helps to avoid mistakes due to inattention. Any violations of the standard become immediately noticeable.
What is the difficulty of using IDEF0
It is important to understand that only in the simplest cases will two business analysts create exactly the same functional models to describe the company’s work. Any model is a reflection of the analyst's experience, depth of understanding of the business he seeks to describe, and also, in some way, his personal point of view on this business. Those. a person develops a business model from the point of view of a manager, as if he were the manager.At the same time, I believe that a business analyst is not exactly a profession; every business manager or developer of some systems who analyzes the business and strives to build the most effective system is engaged in business analytics. It is for these people and for these purposes that the IDEF0 tool is designed.
Therefore, when drawing up a functional “as is” business model, it is very important to constantly consult with the head of the company so as not to make mistakes that will automatically entail errors at the decomposition stages. Also, at subsequent stages, additional approvals may be required from the heads of departments and employees. Only if your “as is” functional model truly reflects the real state of things can you make any changes and suggestions. And to achieve high-quality results in such work, first of all, practical experience and knowledge of the characteristics of a particular type of business are required.
More articles on this topic.
IDEF0 methodology
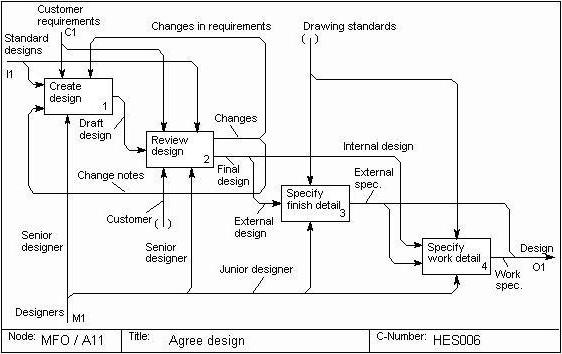
IDEF0 methodology prescribes the construction of a hierarchical system of diagrams - single descriptions of fragments of the system. First, a description of the system as a whole and its interaction with the outside world is carried out (context diagram), after which a functional decomposition is carried out - the system is divided into subsystems and each subsystem is described separately (decomposition diagrams). Then each subsystem is divided into smaller ones, and so on until the desired level of detail is achieved.
Each IDEF0 diagramsA contains blocks and arcs. The blocks depict the functions of the modeled system. Arcs link blocks together and represent the interactions and relationships between them.
Functional blocks (work) in diagrams are represented by rectangles, representing named processes, functions, or tasks that occur over a period of time and have recognizable results. The name of the work must be expressed as a verbal noun denoting the action.
IDEF0 requires that the diagram have at least three and no more than six blocks. These constraints keep the complexity of the diagrams and model at a level that is readable, understandable, and usable.
Each side of the block has a special, very specific purpose. The left side of the block is for inputs, the top is for control, the right is for outputs, and the bottom is for mechanisms. This designation reflects certain system principles: inputs are converted into outputs, control limits or prescribes the conditions for carrying out transformations, mechanisms show what and how a function performs.
Blocks in IDEF0 are placed in order of importance, as understood by the author of the diagram. This relative order is called dominance. Dominance is understood as the influence that one block has on other blocks in the diagram. For example, the most dominant block of the diagram may be either the first of a required sequence of functions, or a planning or controlling function that influences all others.
The most dominant block is usually placed in the upper left corner of the diagram, and the least dominant one is in the right corner.
The arrangement of blocks on the page reflects the author's definition of dominance. Thus, the topology of the diagram shows which features have a greater impact on others. To emphasize this, the analyst can renumber the blocks according to their order of dominance. The order of dominance can be indicated by a number placed in the lower right corner of each rectangle: 1 would indicate the greatest dominance, 2 the next, etc.
The interaction of works with the outside world and with each other is described in the form of arrows, depicted as single lines with arrows at the ends. Arrows represent some information and are called nouns.
IDEF0 distinguishes between five types of arrows.
Entrance- objects used and transformed by work to obtain a result (output). It is allowed that the work may not have a single entry arrow. The entry arrow is drawn as entering the left edge of the work.
Control-.information that controls the actions of the work. Typically, control arrows carry information that indicates what a job should do. Each job must have at least one control arrow, which is depicted as entering the top edge of the job.
Exit- objects into which inputs are converted. Each job must have at least one exit arrow, which is drawn as emanating from the right edge of the job.
Mechanism- resources that perform the work. The arrow of the mechanism is drawn as entering the lower edge of the work. At the discretion of the analyst, the arrows of the mechanism may not be depicted on the model.
Call- a special arrow pointing to a different operating model. The call arrow is drawn as coming from the bottom of the work and is used to indicate that some work is being performed outside of the system being modeled.
Rice. 2.1 Types of arrows
The IDEF0 methodology requires only five types of interactions between blocks to describe their relationships: control, input, control feedback, input feedback, output-mechanism. Control and input connections are the simplest because they reflect direct influences that are intuitive and very simple.
Rice. 2.2. Output communication
Rice. 2.3. Management Communications
A control relationship occurs when the output of one block directly affects the less dominant block.
Control feedback and input feedback are more complex because they involve iteration or recursion. Namely, the outputs from one job influence the future execution of other jobs, which subsequently affects the original job.
Control feedback occurs then; when the output of some block affects a block with greater dominance.
Output-mechanism relationships are rare. They reflect a situation in which the output of one function becomes a means to an end for another.
Rice. 2.4. Login feedback

Rice. 2.5. Management Feedback
Output-mechanism relationships are characteristic of the allocation of resource sources (eg, required tools, trained personnel, physical space, equipment, funding, materials).
In IDEF0, an arc rarely represents a single object. It usually symbolizes a set of objects. Because arcs represent collections of objects, they can have multiple starting points (sources) and ending points (destinations). Therefore, arcs can branch and connect in various ways. The entire arc or part of it may extend from one or more blocks and end in one or more blocks.
Branching arcs, depicted as radiating lines, means that all or part of the contents of the arcs may appear in each branch. An arc is always labeled before a branch to give a name to the entire set. Additionally, each branch of an arc may or may not be labeled according to the following rules:
unlabeled branches contain the weight of the objects specified in the arc label before the branch;
branches labeled after the branch point contain all or part of the objects specified in the arc label before the branch.
Arc merges in IDEFO, depicted as lines converging together, indicate that the contents of each branch go to form a label for the arc that is the result of the merge of the original arcs. After a merge, the resulting arc is always marked to indicate the new set of objects resulting from the merge. Additionally, each branch may or may not be marked before merging, according to the following rules:
Rice. 2.6. Output-mechanism connection
unlabeled branches contain the weight of the objects specified in the common label of the arc after the merge;
branches marked before merging contain all or some of the objects listed in the common label after merging,
number of blocks on the diagram - N;
diagram decomposition level - L;
balance of the diagram - IN;
number of arrows connecting to the block - A
This set of factors applies to each model diagram. The following will list recommendations on the desired values of the factors in the diagram.
It is necessary to strive to ensure that the number of blocks on the diagrams of lower levels is lower than the number of blocks on the parent diagrams, i.e., as the level of decomposition increases, the coefficient decreases. Thus, the decrease of this coefficient indicates that. that as the model is decomposed, the functions should be simplified, therefore, the number of blocks should decrease.
Diagrams must be balanced. This means that the situation shown in Fig. 1 should not occur within the same diagram. 2.7: work 1 has significantly more incoming arrows and control arrows than outgoing ones. It should be noted that this recommendation may not be followed in models describing production processes. For example, when describing an assembly procedure, a block may include many arrows describing the components of a product, and one arrow exiting - the finished product.

Rice. 2.7. Example of an unbalanced chart
Let's introduce the diagram's balance coefficient
It is necessary to strive to Q was minimal for the chart.
In addition to analyzing the graphic elements of the diagram, it is necessary to consider the names of the blocks. To evaluate names, a dictionary of elementary (trivial) functions of the modeled system is compiled. In fact, this dictionary should include the functions of the lower level of diagram decomposition. For example, for a database model, the functions “find a record” and “add a record to the database” may be elementary, while the function “user registration” requires further description.
After forming a dictionary and compiling a package of system diagrams, it is necessary to consider the lower level of the model. If there are matches between the names of diagram blocks and words from the dictionary, this means that a sufficient level of decomposition has been achieved. The coefficient quantitatively reflecting this criterion can be written as L*C- product of the model level and the number of matches between block names and words from the dictionary. The lower the model level (larger L), the more valuable the matches are.
When you start BPWin, the main toolbar, tool palette, and Model Explorer appear by default.
When creating a new model, a dialog appears in which you should indicate whether the model will be created anew, or it will be opened from the ModelMart repository, enter the name of the model and select the methodology in which the model will be built (Fig. 2.8).

Fig.2.8 Model creation dialog
BPWin supports three methodologies - IDEF0, IDEF3 and DFD. In BPWin it is possible to build mixed models, i.e. the model can simultaneously contain both IDEF0 and IDEF3 diagrams and DFD. The composition of the tool palette changes automatically when you switch from one notation to another.
A model in BPWin is considered as a set of works, each of which operates with a certain set of data. If you click on any model object with the left mouse button, a pop-up context menu appears, each item of which corresponds to the editor of a property of the object.
Building a system model should begin with studying all the documents describing its functionality. One of these documents is the technical specification, namely the sections “Purpose of development”, “Goals and objectives of the system” and “Functional characteristics of the system”.
After studying the source documents and interviewing customers and users of the system, it is necessary to formulate the purpose of the modeling and determine the point of view on the model. Let's consider the technology of its construction using the example of the "University Employment Service" system, the main capabilities of which were described in laboratory work No. 1.
Let us formulate the goal of modeling: to describe the functioning of the system, which would be understandable to its user, without going into details related to the implementation. We will build the model from the point of view of users (student, teacher, administrator, dean's office, company).
Let's start by building an IDEF0 context diagram. According to the description of the system, the main function is to serve its clients by processing requests received from them. Thus, we define the only job of the context diagram as “Serve the client of the system.” Next, we define input and output data, as well as mechanisms and control.
In order to serve a client, it is necessary to register him in the system, open access to the database and process his request. The input data will be “client name”, “client password”, “source database”, “client request”. Executing a request leads either to receiving information from the system or to changing the contents of the database (for example, when compiling expert assessments), so the output data will be “reports” and “changed database”. The request processing process will be performed by the system monitor under the control of the administrator.
Thus, we define the context diagram of the system (Fig. 2.9).

Figure 2.9. System Context Diagram
Let's decompose the context diagram, describing the sequence of customer service:
Determining the level of access to the system.
Subsystem selection.
Access to the subsystem.
Changing the database (if necessary).
We get the diagram shown in Fig. 2.10.
Having completed the decomposition of the context diagram, proceed to the decomposition of the next level diagram. Typically, when considering the third and lower levels, models return to the parent diagrams and adjust them.

Rice. 2.10. Decomposition of the work “Service, system client”
We decompose sequentially all the blocks of the resulting diagram. The first step in determining the level of access to the system is to determine the user category. The client's name is searched in the user database, determining its category. According to a certain category, the powers granted to the user of the system are determined. Next, the procedure for accessing the system is carried out, checking the access name and password. By combining information about authorities and access level to the system, a set of allowed actions is formed for the user. Thus, determining the access level to the system will look like shown in Fig. 2.11.

Rice. 2.11. Decomposition of the work “Determining the level of access to the system”
After completing the system access procedure, the monitor analyzes the client's request, selecting the subsystem that will process the request. The decomposition of the work “Appeal to a subsystem” does not correspond to the purpose and point of view of the model. The user of the system is not interested in the internal algorithms of its operation. In this case, it is important for him that the choice of subsystem will be made automatically, without his intervention, so decomposition of access to the subsystem will only complicate the model.
We decompose the work “Processing a client request”, performed by the subsystem for processing requests, determining the categories and powers of users. Before searching for an answer to a query, you must open the database (connect to it). In general, the database may be located on a remote server, so it may be necessary to establish a connection to it. Let's determine the sequence of work:
Opening the database.
Executing the request.
Generating reports.
After opening the database, you need to inform the system that a connection to the database has been established, then execute the request and generate reports for the user (Fig. 2.12).
It should be noted that “Query Execution” includes the work of various subsystems. For example, if the request includes testing, then it will be executed by the subsystem of professional and psychological tests. At the query execution stage, it may be necessary to change the contents of the database, for example, when compiling expert assessments. Therefore, it is necessary to provide for this possibility in the diagram.

Rice. 2.12.
When analyzing the resulting diagram, the question arises: what rules are used to generate reports? It is necessary to have pre-generated templates that will be used to select from the database, and these templates must correspond to queries and must be pre-defined. In addition, the client should be given the opportunity to choose the form of the report.
Let’s adjust the diagram by adding the “Report Templates” and “Database Change Requests” arrows and the “System Client” tunnel arrow. Tunneling of the “System Client” is used in order not to place the arrow on the top diagram, since the function of selecting the report form is not important enough to be displayed on the parent diagram.
Changing the diagram will result in adjustments to all parent diagrams (Fig. 2.13 - 2.15).
It is advisable to decompose the “Query Execution” work using a DFD diagram (laboratory work No. 3), since the IDEF0 methodology considers the system as a set of interrelated works, which does not reflect information processing processes well.

Rice. 2.13. Decomposition of the work “Processing a client’s request”

Rice. 2.14. Decomposition of the work “System client service” (option 2)

Rice. 2.15. System context diagram (option 2)
Let's move on to the decomposition of the last block “Changing the Database”. From the client's point of view, the system data is located in one database. In reality, there are six databases in the system:
user database,
student database, (option 2)
vacancy database,
academic performance database,
Test database,
DB of expert assessments,
DB resume.
According to the purpose of modeling, it is important for the client to understand that the received data is not immediately updated in the system, but goes through an additional stage of processing and control. The change algorithm can be formulated as follows:
The database in which the information will be changed is determined.
The operator creates a temporary set of data and provides it to the administrator.
The administrator controls the data and enters it into the database.
This model can be implemented in a different way, by providing the ability to update the database directly upon requests, bypassing the data control process. In this case, it is necessary to ensure control of the integrity of the database to avoid its damage. In this case, the diagram will look like this (Fig. 2.17).

Rice. 2.16. Decomposition of the work “Changing the database”

Rice. 2.17. Decomposition of the work “Changing the database” (option 2) For the first option, shown in Fig. 2.12
Carrying out further decomposition of “Database Changes” will complicate the model, explaining how the physical change of the database in the system is carried out. In this case, the user will not receive any additional information about the operation of the employment service system. It is advisable to decompose this work during the design process of a database system at the stage of creating a logical model of the database.
A decomposition of the Query Execution work will be carried out in the next lab, illustrating the use of DFD diagrams to describe information processing processes.
Let us carry out a quantitative analysis of the models shown in Fig. 2.12 and 2.13, according to the method described above. Let us consider the behavior of the coefficient ^ for these models. The parent diagram “Processing a client request” has a coefficient of 4/2 = 2, and the decomposition diagram has 3/3 = 1. The value of the coefficient decreases, which indicates a simplification of the description of functions as the level of the model decreases.
Let's consider the change in the coefficient TO b have two model options.
for the second option
Coefficient TO b does not change its value, therefore, the balance of the diagram does not change.
We will assume that the level of decomposition of the diagrams considered is sufficient to reflect the purpose of the modeling, and in the diagrams of the lower Level, elementary functions are used as names of work (from the point of view of the system user).
Summarizing the considered example, it is necessary to note the importance of considering several diagram options when modeling a system. Such options may arise when adjusting diagrams, as was done with “Processing a Client Request” or when creating alternative implementations of system functions (decomposition of the work “Changing the Database”). Reviewing the options allows you to select the best one and include it in a package of diagrams for further consideration.
Most of those involved in the implementation of projects related to the creation or development of corporate information systems agree with the thesis that the customer needs an information system that increases the efficiency of the enterprise. However, customers and developers of information systems still speak different languages: they have different understandings of what it means to increase the efficiency of an enterprise.
Information system developers very often understand increased efficiency as an increase in the number of workstations in the local computer network (LAN) of an enterprise, an increase in LAN throughput, an increase in the number of documents processed at automated workstations (AWS), etc.
By increasing the efficiency of an enterprise, customers understand an increase in labor productivity, a reduction in costs and an increase in the quality of products and services produced. Recently, new conditions and new concepts are rapidly breaking into the lives of customers: development strategy, core competencies, business architecture, business rules and much more.
In order for the customer and the developer of the information system to understand each other, it is necessary for the developer to reorient himself from solving technical problems of creating or developing an information system to solving complex problems of increasing the efficiency of the customer’s enterprise. With this approach, the problem of an effective way to study the customer’s field of activity comes to the fore:
- survey of existing business architecture, business processes, business rules, information flows;
- identification of problems, bottlenecks that negatively affect the efficiency of the enterprise;
- development and implementation of measures to eliminate existing problems and change the business architecture of the enterprise, restructuring business processes;
- development of a specific project for a corporate information system, implementation of this project and support in the future.
As part of this approach, tools designed for enterprise modeling and re-engineering of business processes are designed to increase the efficiency of the information systems developer. One of the representatives of this family of tools is CASE tools for functional modeling of business processes.
This article provides an overview of one class of tools for functional modeling of business processes, focused on the use of the IDEF0 methodology.
IDEF0 - functional modeling methodology
During the implementation of the Integrated Computerization of Manufacturing (ICAM) program, proposed at one time by the Air Force for the US aerospace industry, the need was identified to develop methods for analyzing the interaction of processes in production systems. To meet this need, the IDEF0 (Integrated Definition Function Modeling) methodology was developed, which is now adopted as a US federal standard. The methodology has been successfully applied in a wide variety of industries, demonstrating itself as an effective means of analyzing, designing and representing business processes. Currently, the IDEF0 methodology is widely used not only in the United States, but throughout the world. In Russia, IDEF0 has been successfully used in government agencies (for example, in the State Tax Inspectorate), in the aerospace industry (when designing the Plesetsk cosmodrome), in the Central Bank and commercial banks of Russia, in the oil and gas industry and in other industries.
IDEF0 Basic Concepts
The IDEF0 methodology is based on the concept of a block that represents a certain business function. The four sides of the block have different roles: the left side has the meaning of “input,” the right side has the meaning of “output,” the top has the meaning of “control,” and the bottom has the meaning of “mechanism” (see Fig. 1).
The interaction between functions in IDEF0 is represented as an arc, which displays the flow of data or materials coming from the output of one function to the input of another. Depending on which side of the block the thread is connected to, it is called “input”, “output”, “control”, respectively.
Modeling principles in IDEF0
IDEF0 implements three basic process modeling principles:
- principle of functional decomposition;
- principle of limitation of complexity;
- principle of context.
The principle of functional decomposition is a way of modeling a typical situation when any action, operation, function can be broken down (decomposed) into simpler actions, operations, functions. In other words, a complex business function can be represented as a collection of elementary functions. By presenting functions graphically, in the form of blocks, you can look inside the block and examine its structure and composition in detail (see Fig. 2).

The principle of limiting complexity. When working with IDEF0 diagrams, it is essential that they be legible and readable. The essence of the principle of limiting complexity is that the number of blocks in the diagram should be no less than two and no more than six. Practice shows that compliance with this principle leads to the fact that functional processes presented in the form of an IDEF0 model are well structured, understandable and easy to analyze.
The principle of a context diagram. Modeling a business process begins with constructing a context diagram. This diagram shows only one block - the main business function of the modeled system. If we are talking about modeling an entire enterprise or even a large division, the main business function cannot be formulated as, for example, “selling products.” The main business function of the system is the “mission” of the system, its significance in the outside world. It is impossible to correctly formulate the main function of an enterprise without having an idea of its strategy.
When defining the main business function, you must always keep in mind the purpose of the modeling and the point of view of the model. The same enterprise can be described differently, depending on the point of view from which it is viewed: the director of the enterprise and the tax inspector see the organization completely differently.
The context diagram plays another role in the functional model. It “fixes” the boundaries of the business system being modeled by defining how the modeled system interacts with its environment. This is achieved by describing arcs connected to a block representing the main business function.
Application of IDEF0
After becoming familiar with the basic concepts and principles of functional modeling of business processes, the natural question is: how does this help improve the efficiency and quality of an enterprise’s activities.
Building the model AS IS. An enterprise survey is a mandatory part of any project for creating or developing a corporate information system. Building an AS IS functional model allows you to clearly record what business processes are carried out in the enterprise, what information objects are used when performing business processes and individual operations. The AS IS functional model is the starting point for analyzing the needs of the enterprise, identifying problems and bottlenecks and developing a project for improving business processes.
Business rules. A business process model allows you to identify and accurately define the business rules used in the activities of an enterprise.
In Fig. Figure 3 shows a fragment of a functional model of document flow. When performing the “sort documents” operation, the business rule is used: “the following are not subject to registration: documents sent as copies for information, telegrams and letters of permission for business trips and vacations...”. This rule is recorded in the document flow instructions. The functional model allows not only to identify the existence of this rule, but also to determine during which operation and at which workplace it should be applied.

Within the framework of the functional model, the business rule is as follows: “if a document intended for management is received at the reception, it is subject to sorting, as a result of which, based on the instructions, it is determined whether the document is subject to registration or not.”
If this business rule is not taken into account when developing an information system, then such a system will function inadequately.
Very often, business rules at an enterprise are not written down in instructions: they seem to exist, but they also seem to be absent. As a result, attempts to change anything in the activities of an enterprise or department may fail only because these changes contradict established business rules.
Information objects. The functional model allows you to identify all the information objects that the enterprise operates in its activities. Unlike information models (Data Flow Diagrams, IDEF1X), the IDEF0 functional model reflects exactly how information objects are used within business processes.
Building a model of HOW IT WILL BE. The creation and implementation of a corporate information system leads to changes in the conditions for performing individual operations, the structure of business processes and the enterprise as a whole. This leads to the need to change the system of business rules used in the enterprise and modify employee job descriptions. The functional model AS WILL BE allows us to determine these changes already at the design stage of the future information system. The use of the HOW TO BE functional model allows not only to reduce the implementation time of the information system, but also to reduce the risks associated with the insusceptibility of personnel to information technology.
Resource Allocation. The functional model allows you to clearly define the distribution of resources between business process operations, which makes it possible to evaluate the efficiency of resource use.
This task is especially relevant when creating new business processes in an enterprise. For example, a company that specializes in custom software development decided to create its own sales department. A functional model of the business process for selling software will allow the company's management to clearly determine what resources need to be allocated in order to ensure the functioning of the sales service, how many employees need to be recruited to work in the new service, what functional responsibilities these employees must perform, etc.
IDEF0 software systems
Currently, there are many CASE tools that support functional modeling in the IDEF0 standard.
CONCLUSION
The IDEF0 functional modeling methodology is a fairly simple tool that allows developers of corporate information systems to study the customer’s field of activity and solve problems to improve the efficiency of this activity.
The use of functional modeling makes it possible to solve not only the customer’s technical problems related to information technology, but also problems related to the customer’s field of activity. This allows you to turn an information system project from a “stack of paper”, for which the customer does not want to pay, into a service that can bring the customer an additional effect comparable to subsequent automation.
The business modeling process can be implemented within the framework of various techniques, differing primarily in their approach to what the modeled organization is. In accordance with different ideas about organization, methods are usually divided into object-based and functional (structural).
Object techniques consider the modeled organization as a set of interacting objects - production units. An object is defined as a tangible reality - an object or phenomenon that has a clearly defined behavior. The purpose of using this technique is to identify the objects that make up the organization and distribute responsibilities among them for the actions performed.
Functional techniques, the most famous of which is the IDEF technique, consider the organization as a set of functions that transforms the incoming flow of information into an output flow. The process of converting information consumes certain resources. Main difference from object technique consists in a clear separation of functions (methods of data processing) from the data themselves.
From a business modeling point of view, each of the presented approaches has its own advantages. The object approach allows you to build a system that is more resistant to changes and better matches existing ones organization structures. Functional modeling shows itself well in cases where the organizational structure is in the process of change or is generally poorly formed. The approach from the functions performed is intuitively better understood by performers when receiving information from them about their current work.
Functional method IDEF0
The IDEF0 methodology can be considered the next stage in the development of the well-known graphical language for describing functional systems SADT (Structured Analysis and Design Technique). Historically, IDEF0 as a standard was developed in 1981 as part of an extensive industrial automation program called ICAM (Integrated Computer Aided Manufacturing). The IDEF family of standards inherited its designation from the name of this program (IDEF = Icam DEFinition), and its latest edition was released in December 1993 by the US National Institute of Standards and Technology (NIST).
The purpose of the methodology is to build functional diagram the system under study, describing all the necessary processes with an accuracy sufficient for unambiguous modeling of the system’s activity.
The methodology is based on four main concepts: functional block, interface arc, decomposition, glossary.
(Activity Box) represents some specific function within the system in question. According to the requirements of the standard, the name of each functional block must be formulated in the verbal mood (for example, “produce services”). In the diagram, a functional block is depicted as a rectangle (Fig. 6.1). Each of the four sides of the functional block has its own specific meaning (role), and:
- the top side is set to “Control”;
- the left side is set to "Input";
- the right side is set to "Output";
- the bottom side has the meaning "Mechanism".
Rice. 6.1.
Interface arc Arrow displays a system element that is processed by a function block or otherwise affects the function represented by the function block. Interface arcs are often called flows or arrows.
Using interface arcs, various objects are displayed that, to one degree or another, determine the processes occurring in the system. Such objects can be elements of the real world (parts, cars, employees, etc.) or flows of data and information (documents, data, instructions, etc.).
Depending on which side of the functional block this interface arc fits, it is called “incoming”, “outgoing” or “control”.
It should be noted that any functional block, according to the requirements of the standard, must have at least one control interface arc and one outgoing one. This is understandable - each process must occur according to some rules (displayed by the control arc) and must produce some result (outgoing arc), otherwise its consideration does not make any sense.
The mandatory presence of control interface arcs is one of the main differences between the IDEF0 standard and other methodologies of the DFD (Data Flow Diagram) and WFD (Work Flow Diagram) classes.
Decomposition(Decomposition) is a core concept of the IDEF0 standard. The principle of decomposition is applied when breaking a complex process into its constituent functions. Wherein level of detail process is determined directly by the model developer.
Decomposition allows you to gradually and structuredly present the system model in the form of a hierarchical structure of individual diagrams, which makes it less overloaded and easier to digest.
The last of the IDEF0 concepts is Glossary. For each of the IDEF0 elements - diagrams, function blocks, interface arcs - the existing standard requires the creation and maintenance of a set of corresponding definitions, keywords, narrative statements, etc. that characterize the object displayed by this element. This set is called a glossary and is a description of the essence of a given element. The glossary harmoniously complements the visual graphic language, providing the diagrams with the necessary additional information.
The IDEF0 model always begins with a view of the system as a single whole—one functional unit with interface arcs extending beyond the domain under consideration. Such a diagram with one functional block is called context diagram.
In the explanatory text to context diagram must be specified target(Purpose) to construct a diagram in the form of a brief description and recorded point of view(Viewpoint).
Defining and formalizing the goal of developing the IDEF0 model is an extremely important point. In effect, the goal defines the relevant areas in the system under study that need to be focused on first.
The point of view determines the main direction of development of the model and the level of detail required. A clear fixation of the point of view allows you to unload the model by refusing to detail and study individual elements that are not necessary, based on the chosen point of view on the system. The correct choice of point of view significantly reduces the time spent on building the final model.
Identification of subprocesses. In the process of decomposition, the functional block, which in context diagram displays the system as a whole and is detailed in another diagram. The resulting second-level diagram contains function blocks that display the main subfunctions of the function block context diagram, and is called a Child Diagram in relation to it (each of the functional blocks belonging to a child diagram is respectively called a Child Box). In turn, the ancestor functional block is called the parent block in relation to the child diagram (Parent Box), and the diagram to which it belongs is called the parent diagram (Parent Diagram). Each of the subfunctions of a child diagram can be further detailed by a similar decomposition of its corresponding functional block. In each case of decomposition of a functional block, all interface arcs entering or emanating from this block are fixed on the child diagram. This achieves the structural integrity of the IDEF0 model.
Sometimes it makes no sense to continue to consider individual interface arcs of a higher level on diagrams of a lower level, or vice versa - to reflect individual arcs of a lower level on diagrams of higher levels - this will only overload the diagrams and make them difficult to understand. To solve such problems, the IDEF0 standard provides the concept of tunneling. The "Arrow Tunnel" designation of two parentheses around the start of an interface arc indicates that the arc was not inherited from a functional parent block and appears (from the "tunnel") only in this diagram. In turn, the same designation around the end (arrow) of the interface arc in the immediate vicinity of the receiver block means the fact that this arc will not be displayed or considered in the child diagram of this block. Most often, it happens that individual objects and their corresponding interface arcs are not considered at some intermediate levels of the hierarchy - in this case, they are first “immersed in the tunnel”, and then, if necessary, “returned from the tunnel”.
- Creation of a model by a group of specialists related to various areas of the enterprise. This group is called Authors in IDEF0 terms. Building the initial model is a dynamic process during which the authors interview competent individuals about the structure of various processes, creating models of departmental activities. They are interested in answers to the following questions:
What does the department receive as input?
- What functions and in what sequence are performed within the department?
- Who is responsible for performing each function?
- What is the performer guided by when performing each of the functions?
- What is the result of the department's work (output)?
Based on existing regulations, documents and survey results, a Model Draft of the model is created.
- Distributing the draft for review, approval and comment. At this stage, the draft model is discussed with a wide range of competent persons (in terms of IDEF0 - readers) in the enterprise. In this case, each of the diagrams of the draft model is criticized and commented on in writing, and then transferred to the author. The author, in turn, also agrees in writing with the criticism or rejects it, outlining the logic of the decision, and returns the revised draft for further consideration. This cycle continues until authors and readers reach a consensus.
- Official approval of the model. The agreed model is approved by the head of the working group if the authors of the model and readers have no disagreement about its adequacy. The final model is a coherent view of the enterprise (system) from a given point of view and for a given purpose.
The clarity of the IDEF0 graphic language makes the model completely readable even for people who did not take part in the project of its creation, as well as effective for showings and presentations. In the future, based on the constructed model, new projects can be organized aimed at making changes in the model.
IDEF0 diagrams are built using the BPWin program. They are intended for graphical modeling of ongoing business processes
About the IDEF0 methodology
The IDEF0 methodology is widely used due to its simple and easy to understand graphical notation, the use of which for building a model is very convenient. The main place in the methodology is given to diagrams. The diagrams display the functions of the system using geometric rectangles, as well as the existing connections between the functions and the external environment. Relationships are displayed using arrows. You can see this by seeing what the IDEF0 diagram offers, examples of which can be found in this article.
The fact that only two graphic primitives are used in the modeling makes it possible to quickly explain the current rules of IDEF0 interactions to those people who have no idea about it. Through IDEF0 diagrams, the customer is connected to the ongoing processes more quickly thanks to the use of a visual graphic language. You can see what the IDEF0 diagram offers, examples of which are presented below.

Elements used for IDEF0
As already mentioned, 2 types of geometric primitives are used: rectangles and arrows. Rectangles represent certain processes, functions, jobs or tasks that have goals and lead to a designated result. The interaction of processes between themselves and the external environment is indicated by arrows. IDEF0 distinguishes 5 different types of arrows.

Possible uses of IDEF0
The IDEF0 methodology can be used to describe the functional aspect of any information system.
Types of connections between processes IDEF0
It is in the interests of the model to create such connections of constructions so that internal connections are as strong as possible, and external ones as weak as possible. This is the strength of modeling with IDEF0. You can see examples of diagrams for yourself and see the veracity of these words. To facilitate the establishment of connections, similar ones are combined into modules. External connections are established between modules, and internal connections are established within modules. There are several types of connections.
1. Hierarchical (“part” - “whole”) connection.
2. Manager (regulating, subordinate):
2) control feedback.
3. Functional or technological:
2) reverse input.
3) consumer;
4) logical;
5) methodological or collegial;
6) resource;
7) informational;
8) temporary;
9) random.
Building blocks and connections in diagrams
The IDEF0 methodology provides a number of rules and recommendations for its use and improvement of the quality of use. So, the diagram displays one block on which you can specify the name of the system and its purpose. There are 2-5 arrows leading to or from the block. You can have more or less, but at least two arrows are needed for entry/exit, and the rest are for additional work and their indication on the diagram. If the arrow is more than 5, you should think about the optimal construction of the model, and whether it is possible to make it even more detailed.

Building blocks in decomposition diagrams
The number of blocks that will be on one diagram is recommended to be 3-6. If there are fewer of them, then such diagrams are unlikely to carry meaning. If the number of blocks is huge, then reading such a diagram will be very difficult, given the presence of additional arrows. To improve the perception of information, it is recommended to place blocks from top to bottom and from left to right. This arrangement will reflect the execution logic of the sequence of processes. And also the arrows will create less confusion, having a minimum number of intersections with each other.
If the launch of a certain function is not controlled in any way, and the process can be launched at any time, then this situation is indicated by the absence of arrows indicating control and input. But the presence of such a situation may indicate to potential partners a certain instability and the need to take a closer look at the potential partner.
A block that only has an input arrow indicates that the process receives input parameters, but no control or adjustment occurs during execution. A block that has only a control arrow is used to indicate work that is called only by special order of the control system. They are managed and adjusted at all their stages.
But an example of constructing an IDEF0 diagram can convince you that the most complete and comprehensive type is a diagram with input and control arrows.
Naming
To improve visual perception, each block and each arrow should have its own name, which will allow them to be identified among many other blocks and arrows. This is what example diagrams look like in IDEF0. An information system built with their help will make it possible to understand all the shortcomings and complexities of the models.
Merging arrows is often used, and questions arise about their naming. But merging is only possible if homogeneous data is transferred, so separate names are not needed, although they can be specified in the BPWin program. Also, if there is a divergence of arrows, then they can be named separately in order to understand what is responsible for what.
If there is no name after the branch, then the name is considered to be exactly the same as it was before the branch. This may be the case if two blocks require the same information. The IDEF0 context diagram, an example of which can be found in this article, will confirm these words.
Arrow information
Arrows entering and leaving the same block when constructing a composition diagram should be displayed on it. The names of geometric figures transferred to the diagram must exactly repeat the highest level information. If two arrows are parallel to each other's arcs (i.e. they start on the edge of one process and both end on the same edge of another process), then perhaps to optimize the model they should be combined and given an appropriate name, which is perfectly displayed in IDEF0 (example diagrams in Visio can be viewed).
An example of implementing the IDEF0 methodology on a specific model
You have already learned what an IDEF0 diagram is, you have partially seen examples and rules for constructing such diagrams. Now we should turn to practice. For a better understanding, the explanation will not be based on some “general” model, but on a specific example, which will allow you to better and more fully understand the features of working with IDEF0 in the BPWin program.
An example will be the speed of a train from point A to point B. It must be taken into account that the train cannot reach a speed greater than the permissible speed. This line is established on the basis of operating experience and the influence of trains on the railway track. It should be understood that the purpose of the train is to transport passengers, who, in turn, have paid to reach their destination safely and comfortably. An IDEF0 diagram is useful, examples of which can be found in this article.

The initial information is:
- data about the track line;
- passport for the entire distance;
- route plan.
Control data:
- Instructions from the boss, the head of the track service.
- Information about the existing flow of trains.
- Information about planned repairs, reconstructions and changes in tracks.
The result of the model is:
- Limitation of permissible speeds indicating the reason for the limitation.
- Permissible speeds when moving at separate points and during the transfer of trains.
Once the context diagram is constructed, it must be detailed and then a composite diagram is created, which will be the first level diagram. It will show all the main functions of the system. The IDEF0 methodology and diagram for which the decomposition is done is called the parent. The IDEF0 decomposition is called a child decomposition.
Conclusion
After decomposition at the first level, decomposition at the second level is carried out - and so on until further decomposition loses its meaning. All this is done to obtain the most detailed graphic diagram of ongoing and planned processes. This is a ready-made example of an IDEF0 diagram that you can use right now.


